A long-term view

2026 Annual report highlights

Man in a store holding a product box and bottle

Our purpose

We generate attractive returns for our shareholders and co-investors by investing in private equity and infrastructure assets. As proprietary capital investors, we have a long-term, responsible approach. We aim to compound value through thoughtful origination, disciplined investment and active management of our assets, driving sustainable growth in our investee companies.

Performance
01
Statements
02
David Hutchison, Chair

FY2026 saw 3i deliver another year of consistent execution against its strategy, driving long-term growth for shareholders despite market volatility and geopolitical uncertainty.

David Hutchison, Chair
Download Chair's statement

In FY2026, we generated a total return on shareholders’ funds of £5,304 million, or 22%, closing the year with a NAV per share of 3,030 pence. Over the last 14 years, we have grown NAV per share by 986%, demonstrating our success in compounding value through volatile market cycles and generating attractive long-term returns for our shareholders.

Simon Borrows, Chief Executive
Download Chief Executive's statement
Simon Borrows, Chief Executive

An outstanding track record

FY2012
FY2026

+986%

GROWTH IN NAV PER SHARE

FY2012
FY2026

+18%

CAGR

Strategy
03

Strategic objectives and key performance indicators1,2,3

Grow investment portfolio earnings Realise investments with good cash-to-cash returns Maintain an operating cash profit Use our strong balance sheet Increase shareholder distributions
  • Navy circular icon showing a bar chart with an upward-trending arrow, representing Grow investment portfolio earnings Green circular icon with white £ sign, represents Realise investments with good cash-to-cash returns

    The performance of the proprietary investment portfolio expressed as a percentage of the opening portfolio value.

    FY2026 progress and FY2027 outlook

    • Group GIR of 21%, driven by £4,166 million of unrealised value growth, a foreign exchange gain of £809 million and £400 million of portfolio income
    • Private Equity GIR of £5,303 million, or 23%, predominantly driven by Action's GIR of £4,510 million
    • Infrastructure GIR of £106 million, or 7%, reflecting an increase in 3iN's share price, dividend income and performance across our Infrastructure funds
    • Scandlines GIR of £55 million, or 10%, reflecting resilient performance in the year and cash distributions
    • Our portfolios have shown good resilience at the start of FY2027
    Gross Investment Return bar chart
  • Navy circular icon showing a bar chart with an upward-trending arrow, representing Grow investment portfolio earnings Green circular icon with white £ sign, represents Realise investments with good cash-to-cash returns Blue circular icon with a white bullseye target, representing Maintain an operating cash profit

    The measure of the fair value per share of our investments and other assets after the net cost of operating the business and dividends paid in the year.

    FY2026 progress and FY2027 outlook

    • 19% increase in NAV per share to 3,030 pence (31 March 2025: 2,542 pence), after payment of 79 pence dividend per share in the year
    NAV per share bar chart
  • Green circular icon with white £ sign, represents Realise investments with good cash-to-cash returns Pink circular icon with white percentage symbol, represents Increase shareholder distributions

    Cash realisations support our returns to shareholders, as well as our ability to invest in new opportunities.

    FY2026 progress and FY2027 outlook

    • Cash proceeds of £1,517 million including £944 million of proceeds received from Action's capital restructuring and £529 million from the realisations of MPM and MAIT
    • Realisations and refinancings in FY2027 are subject to supportive market conditions and to portfolio company performance remaining resilient
    Cash realisations bar chart
  • Navy circular icon showing a bar chart with an upward-trending arrow, representing Grow investment portfolio earnings Yellow circular icon featuring a document with a checkmark, represents Realise investments with good cash-to-cash returns Pink circular icon with white percentage symbol, represents Increase shareholder distributions

    Identifying and investing in new and further investments is a key driver of the Group's ability to deliver attractive returns.

    FY2026 progress and FY2027 outlook

    • Invested £907 million, including the £827 million investment in Action and £56 million investment in Royal Sanders.
    • Completed four bolt-on acquisitions for the Private Equity portfolio and three bolt-on acquisitions in US infrastructure
    • Good pipeline of new investment opportunities and bolt-on acquisitions
    Cash investment bar chartss
  • Blue circular icon with a white bullseye target, representing Maintain an operating cash profit Pink circular icon with white percentage symbol, represents Increase shareholder distributions

    By covering the cash operating cost of running our business with cash income, we reduce the potential dilution of capital returns.

    FY2026 progress and FY2027 outlook

    • Generated total cash income of £421 million (2025: £598 million) of which £296 million (2025: £470 million) is from Private Equity, £104 million (2025: £106 million) from Infrastructure and £21 million from Scandlines (2025: £22 million). Private Equity includes £246 million of dividends from Action (2025: £433 million). The Action dividend is lower in the year due to timing, with an additional Action dividend expected to be received in May 2026 compared to March in the previous year
    • Cash operating expenses of £145 million (2025: £129 million)
    • Good cash income expected to continue from Action, Infrastructure and Scandlines
    Operating cash profit bar chart
  • Pink circular icon with white percentage symbol, represents Increase shareholder distributions

    The return to our shareholders through the movement of the share price and dividends paid during the year.

    FY2026 progress and FY2027 outlook

    • TSR of (31)% driven by a 33% decrease in the share price between 31 March 2025 and 31 March 2026, partially offset by dividend payments of 79.0 pence in the year
    • The share price decline does not reflect the strong returns delivered during the year
    • Strong balance sheet supports a total FY2026 dividend of 84.5 pence per share
    Total shareholder return bar chart
    1. A number of our KPIs are calculated using financial information which is not defined under IFRS and therefore they are classified as APMs. Further details on these APMs are included in our Financial review on page 93 in the Annual report and accounts 2026.
    2. Further information on how these KPIs are factored into decisions concerning the Executive Directors' remuneration is included in the Directors' remuneration report on page 146 to 169 in the Annual report and accounts 2026.
    3. Key risks which could potentially impact the respective KPIs can be found on pages 100 to 104 in the Annual report and accounts 2026, which summarise the Group's current principal risks.
    4. Realised proceeds may differ from cash proceeds due to the timing of cash receipts.
    5. Excludes the £1.7 billion further investment in Action for non-cash consideration of an equivalent value in the form of 3i Group shares.
    6. Cash operating expenses includes lease payments.
Our portfolio
04

The shape of our business

To find out more about how we added to our growth see below
3i Group investment portfolio as at 31 March 2026
Value-for-money and private label (primarily Action) 80%
Infrastructure, incl. Scandlines 7%
Healthcare 4%
Other discretionary consumer 3%
Industrial 3%
Services 2%
Software 1%
Business overview
05

Long-term hold

Our long-term hold investments are Action and Royal Sanders. We may decide to hold a portfolio company over a longer time period to capitalise on its compounding growth and cash generation via refinancing and dividends.

Aerial view of large Action warehouse and trucks
Action
£23.7bn Valuation at 31 March 2026
£1.2bn Cash proceeds received
in FY2026
Royal Sanders
£1.2bn Valuation at 31 March 2026

Private Equity

Our Private Equity business is funded principally from our proprietary capital, with additional funding from co-investors for selected assets. Its principal focus is to generate attractive capital returns.

Aerial view of small boats in shallow blue water
£29.7bn Portfolio value (including long-term hold portfolio companies) at 31 March 2026
£1.8bn Total cash proceeds received (including long-term hold portfolio companies) in FY2026

Infrastructure

Our Infrastructure business manages assets on behalf of third-party investors and 3i’s proprietary capital, with the objective of generating attractive capital returns and earning fund management fees and portfolio income for the Group.

Aerial view of rows of solar panels
£6.9bn Assets under management (“AUM”) at 31 March 2026
£104m Total cash income in FY2026
Success stories
06

2026 in focus

A long-term compounder

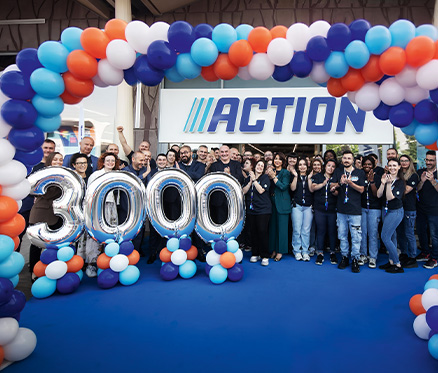
Action, one of the largest non-food discount retailers in Europe, now operates more than 3,300 stores across 15 countries. In 2025, the company welcomed an average of 21.6 million visitors per week, a new record for the business, and generated net sales of €16 billion.

Action's unique customer proposition

Action's winning formula of good-quality products at the lowest prices continues to resonate strongly with customers and, in 2025, Action saw a record average number of weekly store visits from its customers.

Underpinning this customer proposition are the economies of scale Action achieves, enabling the company to pass these benefits back to customers in the form of consistently lower prices. Approximately two thirds of its products are retailed at a price point of less than €2.

Good-quality affordable products

Action offers over 6,000 products across 14 categories. One third of this assortment typically comprises everyday essentials and two thirds a variable selection that reflects customer preferences and seasonal trends. Across its product range, Action continued to receive multiple awards in 2025, demonstrating the quality and value of its offering.

Action store
Net sales and Operating EBITDA charts for Action 2005–2025
Download full Business review
Responsible approach
07
See all Responsible approach

We believe that a responsible approach to investment aligns with our values and supports the delivery of attractive returns from our portfolio over the long term.

We have majority or significant minority holdings in our core portfolio companies and are represented on their boards. We exercise our influence to ensure that they consider their material sustainability-related topics and, where relevant, support them in developing plans to mitigate sustainability risks and invest in value creation opportunities that may arise.

Our people are our most valuable asset. Recruiting, retaining and developing talent is therefore a priority.

Our recruitment, promotion and reward processes are based solely on merit. As an equal opportunities employer, we prohibit all forms of discrimination. We foster an open and non-hierarchical culture and provide an inclusive and supportive working environment with opportunities for training and career development. We promote the physical and mental wellbeing of our employees. We value diversity and believe that a variety of perspectives enhances our decision making.

We expect our employees to act with integrity, accountability and a strong sense of ownership.

They are encouraged to approach their roles with ambition, rigour and energy. We embed that culture in our policies and processes.

Downloads
08