3i Group plc
Annual report and accounts 2025 highlights
Our purpose
We generate attractive returns for our shareholders and co-investors by investing in private equity and infrastructure assets.
As proprietary capital investors, we have a long-term, responsible approach. We aim to compound value through thoughtful origination, disciplined investment and active management of our assets, driving sustainable growth in our investee companies.
Download the FY2025 Annual Report
FY2025 performance
FY2025 performance

“I am pleased to report that 3i delivered another strong set of results in the financial year to 31 March 2025, consistent with our excellent track record of growth since the restructuring in 2012.”
FY2025 performance
-
2,542p
NAV per share
(31 March 2024: 2,085p)
-
25%
Total return on equity
(2024: 23%)
-
73.0p
Dividend per share
(2024: 61.0p)

“In FY2025, we generated a total return on shareholders’ funds of £5,049 million, or 25%, ending the year with a NAV per share of 2,542 pence. This is the fifth consecutive year we have delivered a total return over 20%; over this same period, our average annual total return was 30%.”
Long-term performance

At a glance
3i is an investment company specialising in Private Equity and Infrastructure.
We invest in mid-market companies headquartered in Europe and North America. Our largest investment, Action, is an example of our successful strategy of compounding value over the long term, delivering consistent returns for our shareholders.
3i Group investment portfolio value As at 31 March 2025
£25.6bn
(2024: £21.6bn)
-
Private Equity
£23.6bn
-
Infrastructure
£1.5bn
-
Scandlines
£0.5bn
Total assets under management As at 31 March 2025
£38.7bn
(2024: £34.7bn)
-
Private Equity
£31.9bn
-
Infrastructure
£6.3bn
-
Scandlines
£0.5bn
3i Group investment portfolio by sector as at 31 March 2025
74%
8%
5%
5%
4%
4%
We invest our proprietary capital in mid market businesses headquartered in Europe and North America. Once invested, we work closely with our portfolio companies to deliver ambitious growth plans and aim to compound value from our best investments over the longer term.
DownloadPrivate Equity business review
-
Gross investment return
£5,113m or 26%
(2024: £4,059m or 25%)
-
Cash Investment
£1,177m
(2024: £556m)
-
Realised proceeds
£1,827m
(2024: £866m)
-
Portfolio dividend income
£450m
(2024: £439m)
-
Portfolio growing earnings
97%1
(2024: 93%)
-
Portfolio value
£23,558m
(2024: £19,629m)
Long term hold investments
Our business model
We aim to compound value over time by investing in mid-market companies to create a diverse portfolio with strong growth potential.
We cover our operating costs with income from our portfolio and from fund management fees generated by our Infrastructure business, thereby minimising the dilution of our capital returns.
What enables us to create value
Sectors
Private Equity
Our Private Equity business is funded principally from our proprietary capital, with some funding from co-investors for selected assets. Its principal focus is to generate attractive capital returns.
Consumer & Private Label
Healthcare
Industrial
Services & Software
Infrastructure
Our Infrastructure business manages assets on behalf of third-party investors and 3i’s proprietary capital, with the objective of generating attractive capital returns and earning fund management fees and portfolio income for the Group.
Communications
Utilities
Transport/Logistics
Social Infrastructure
Energy
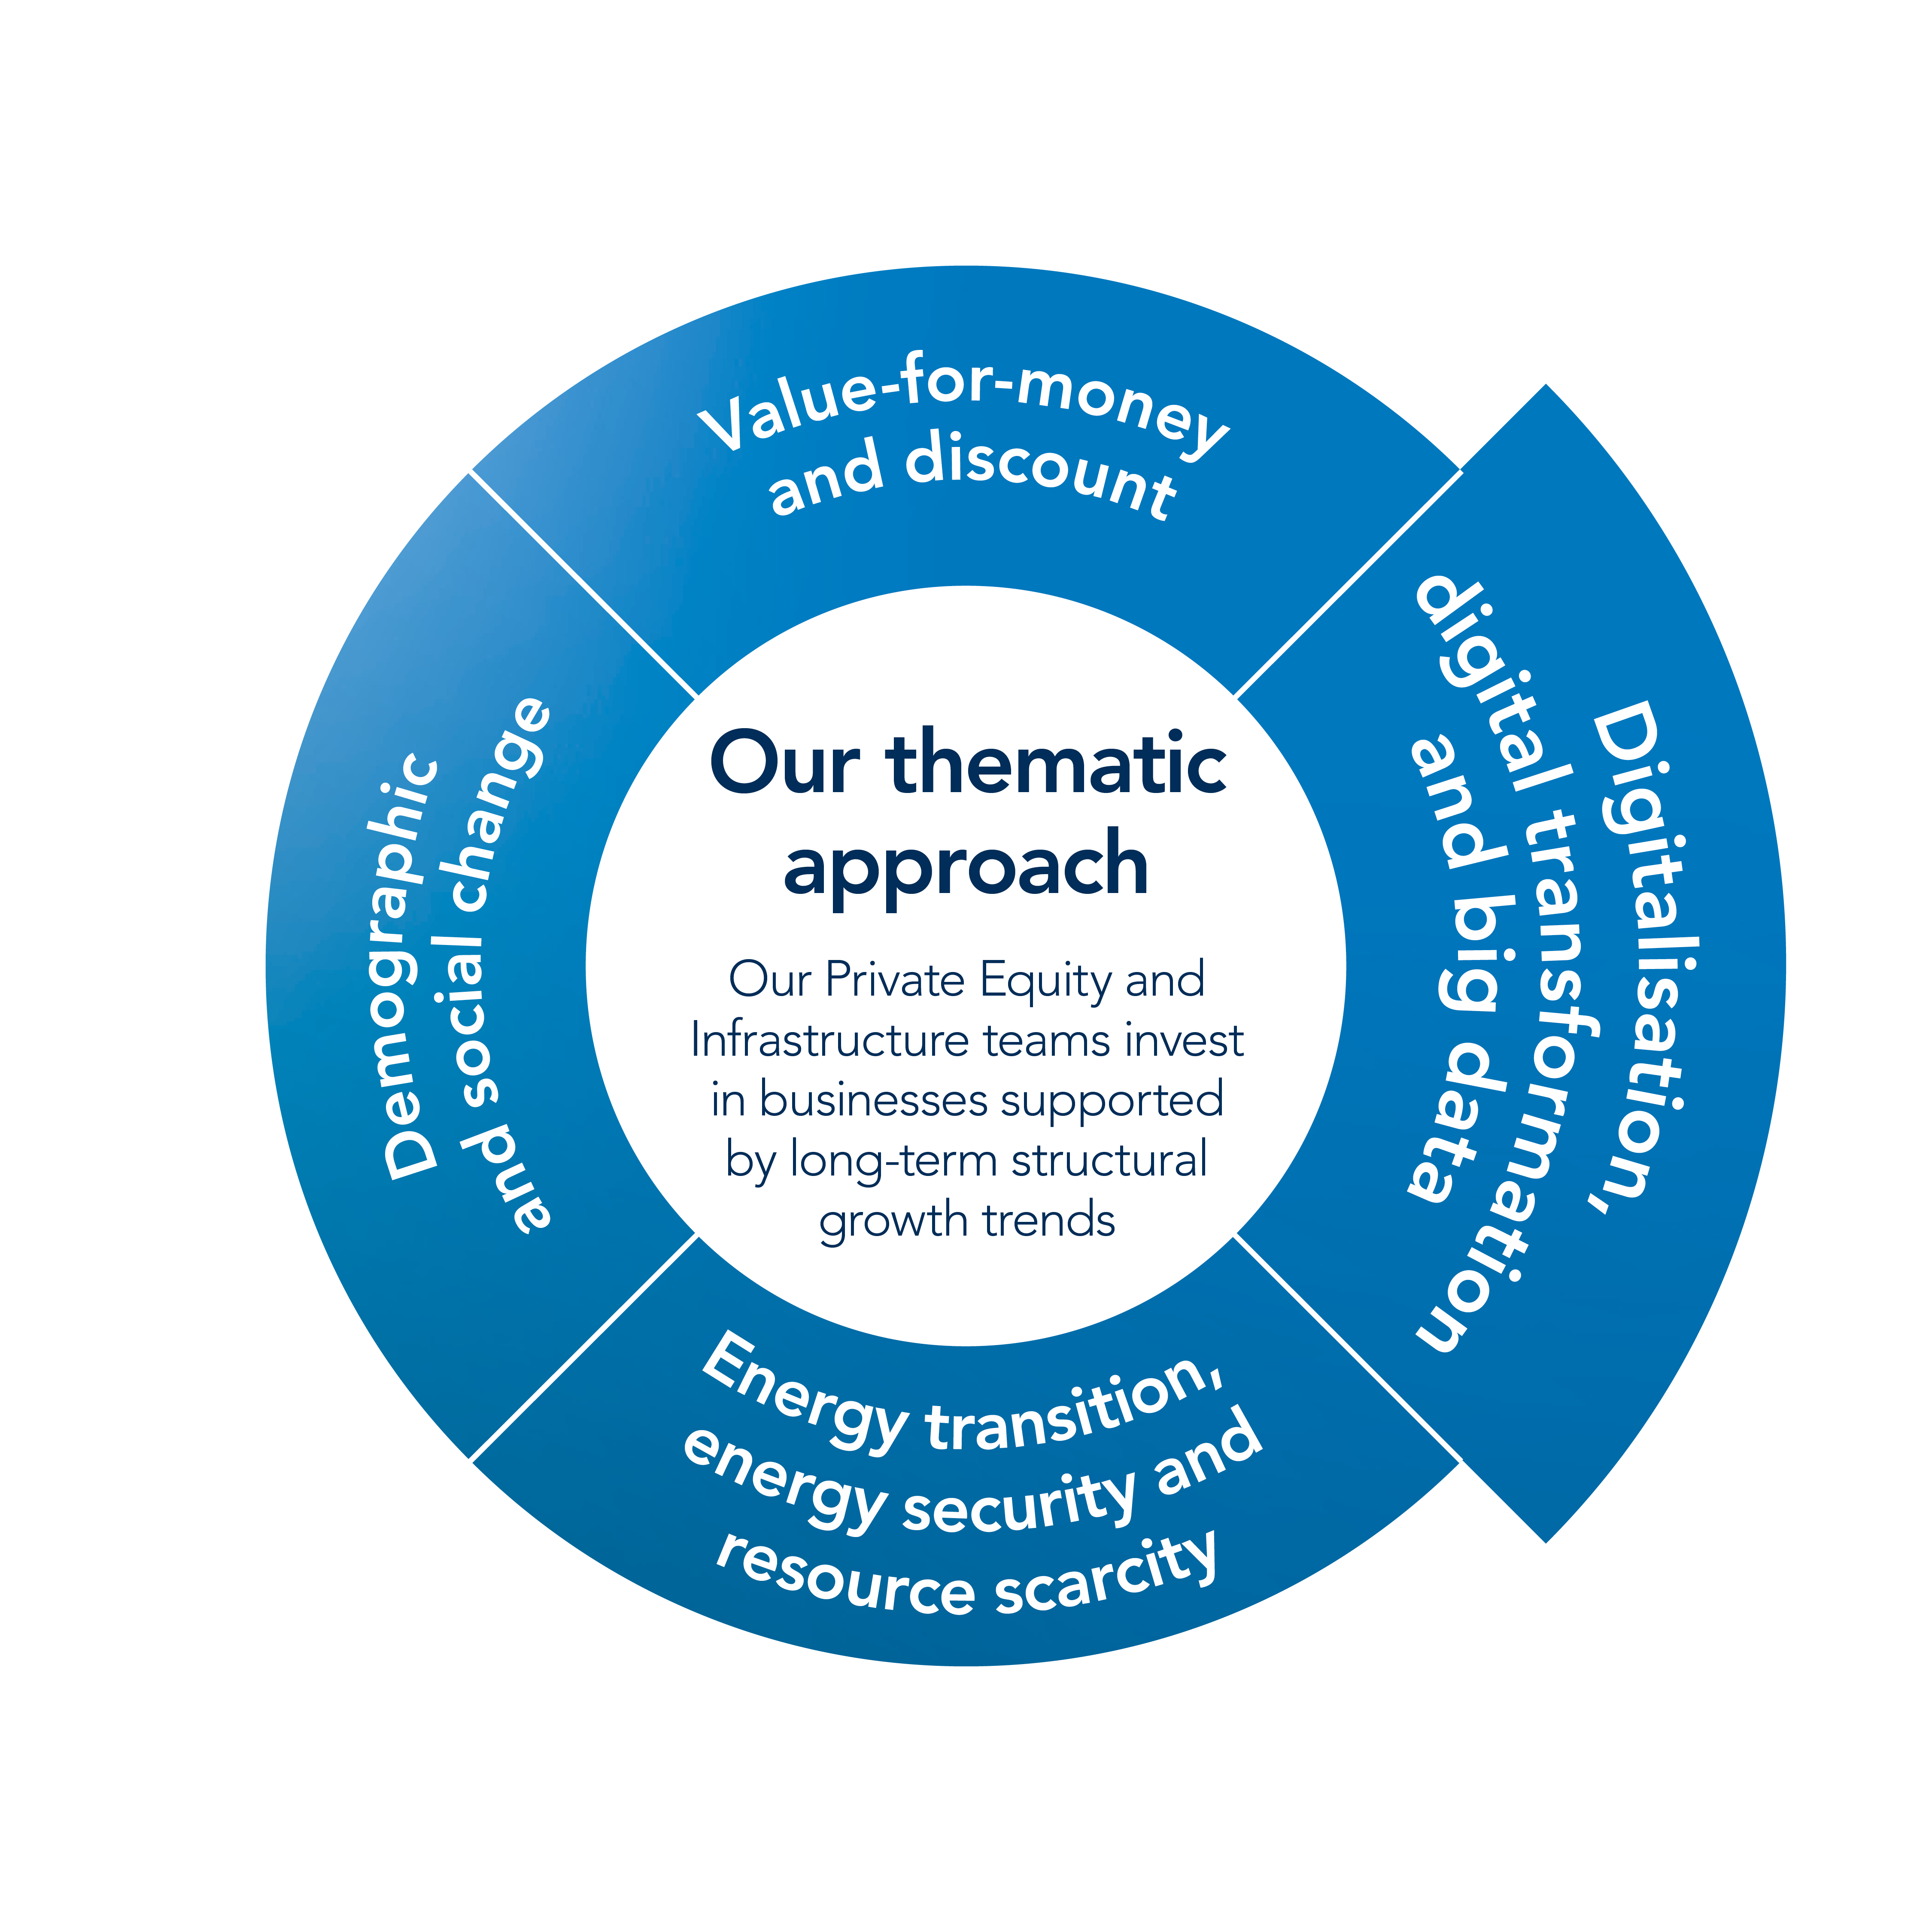
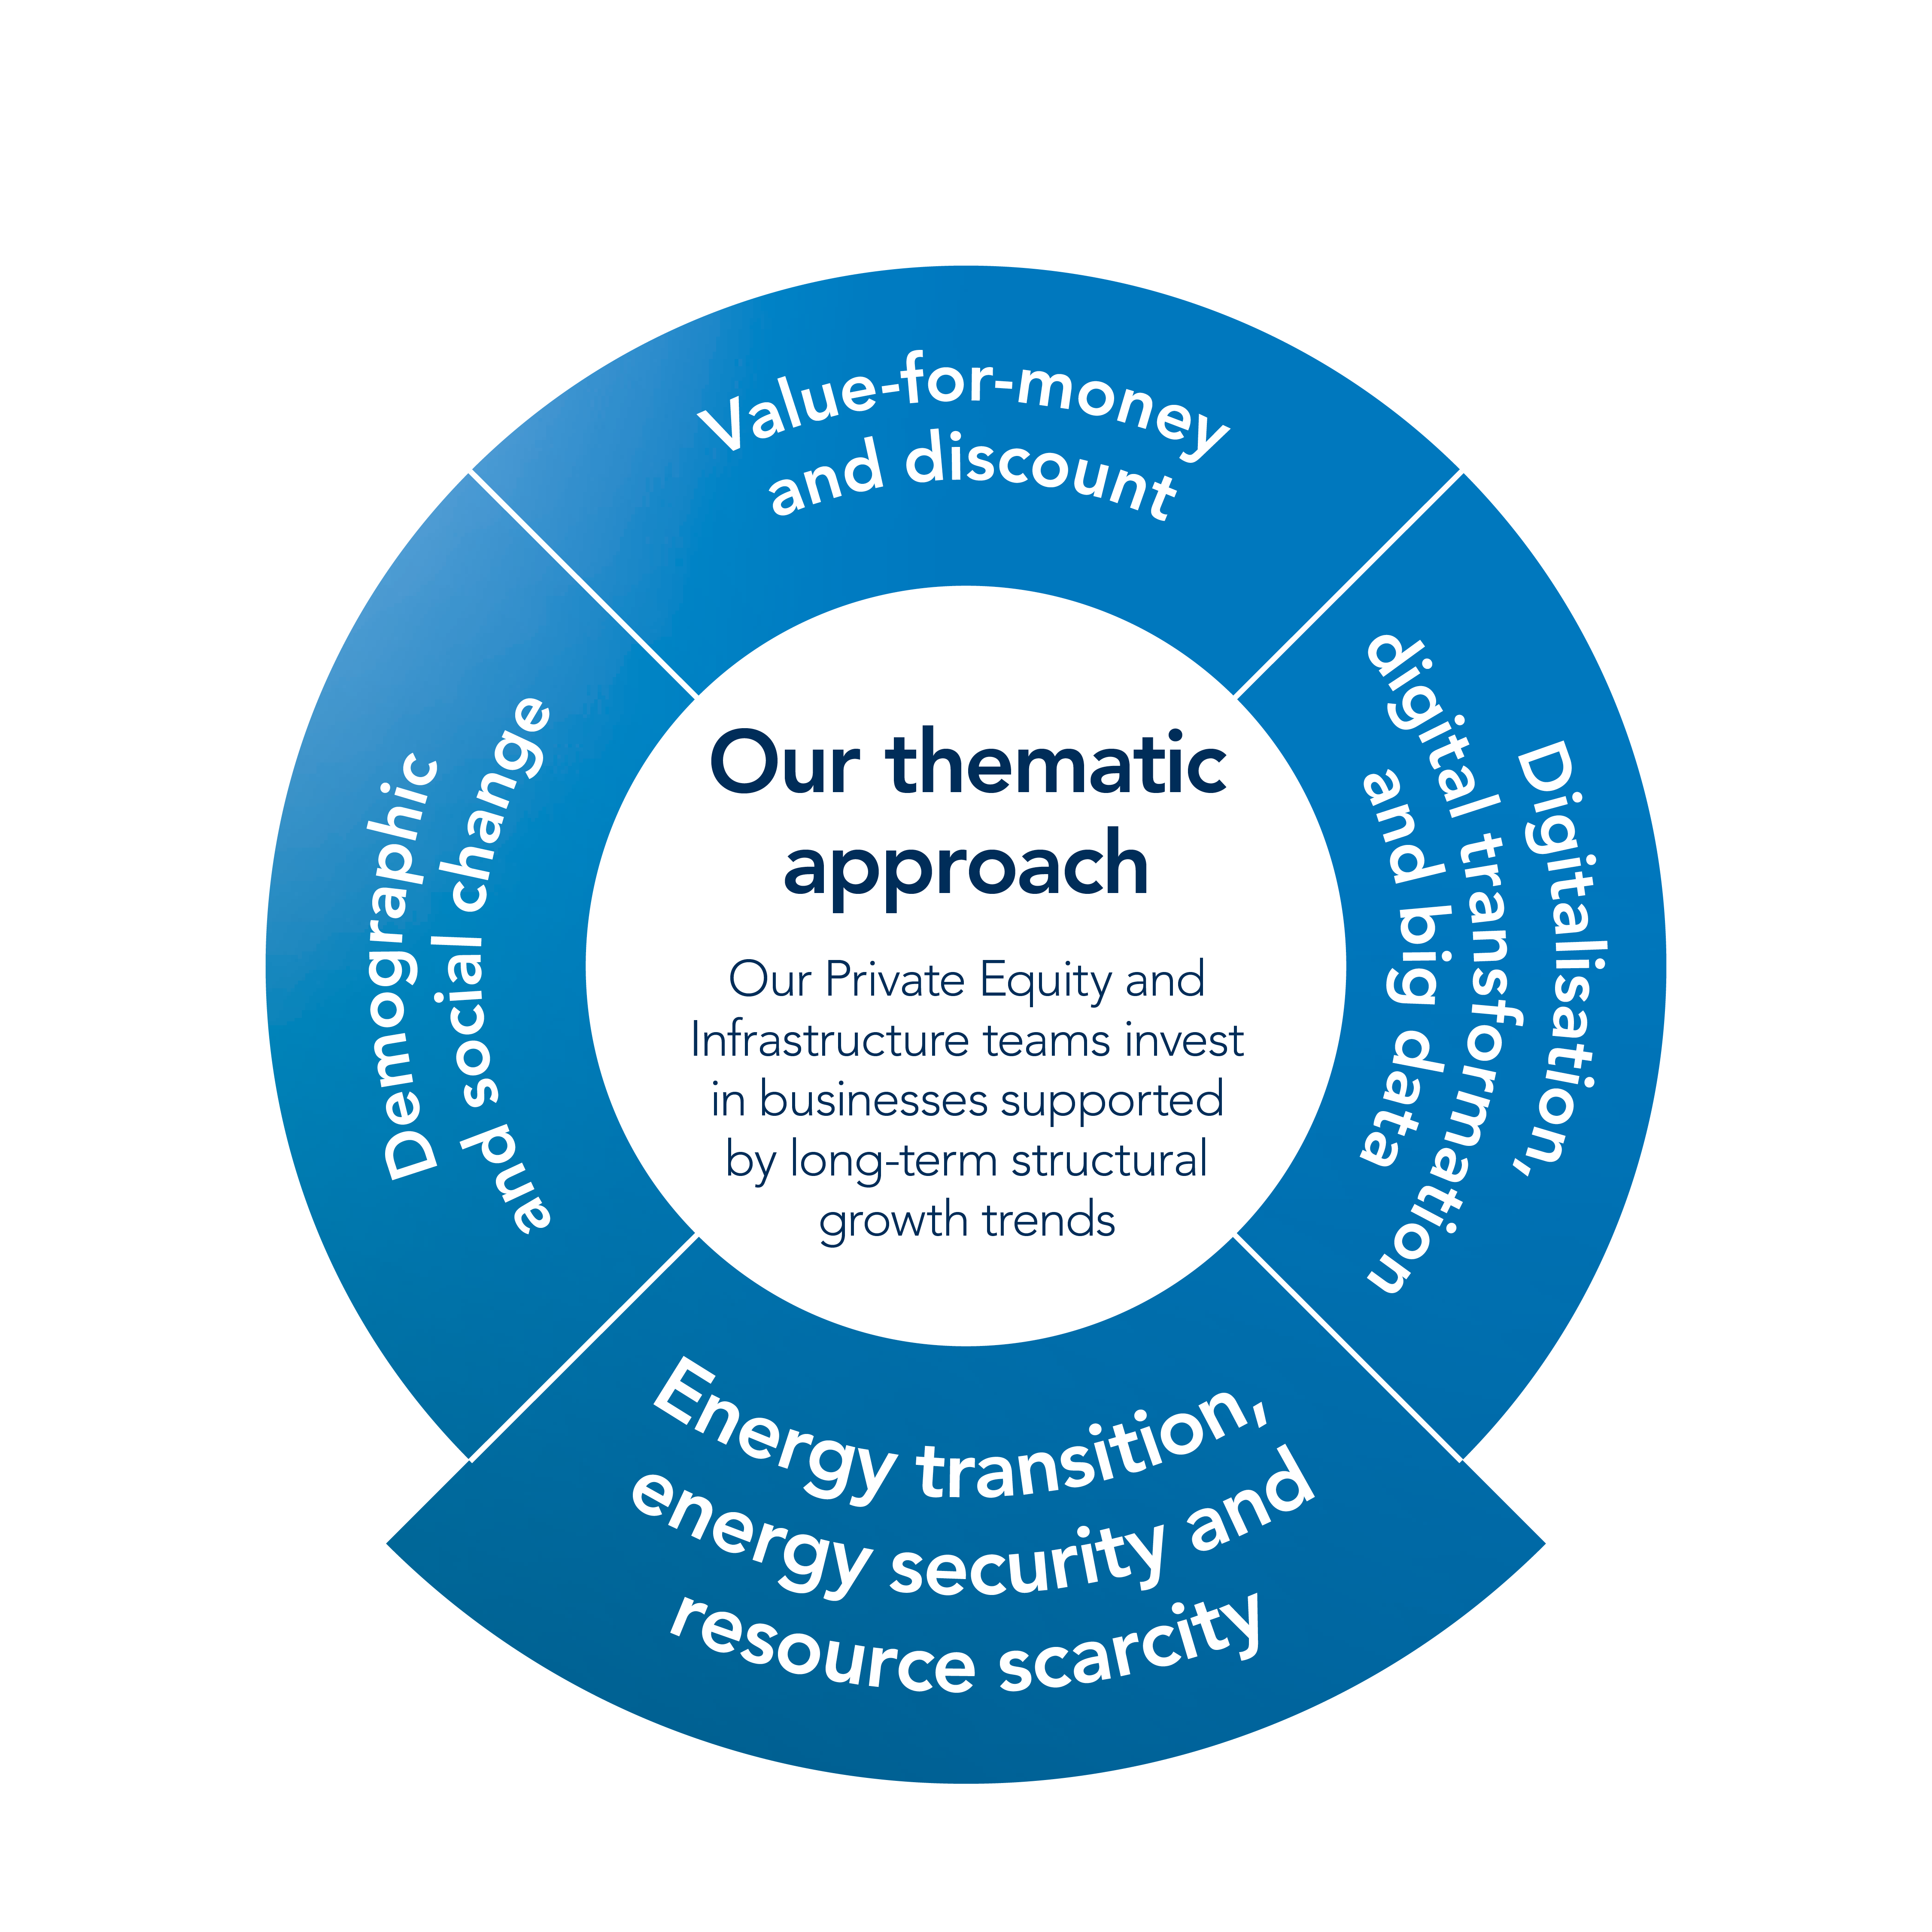
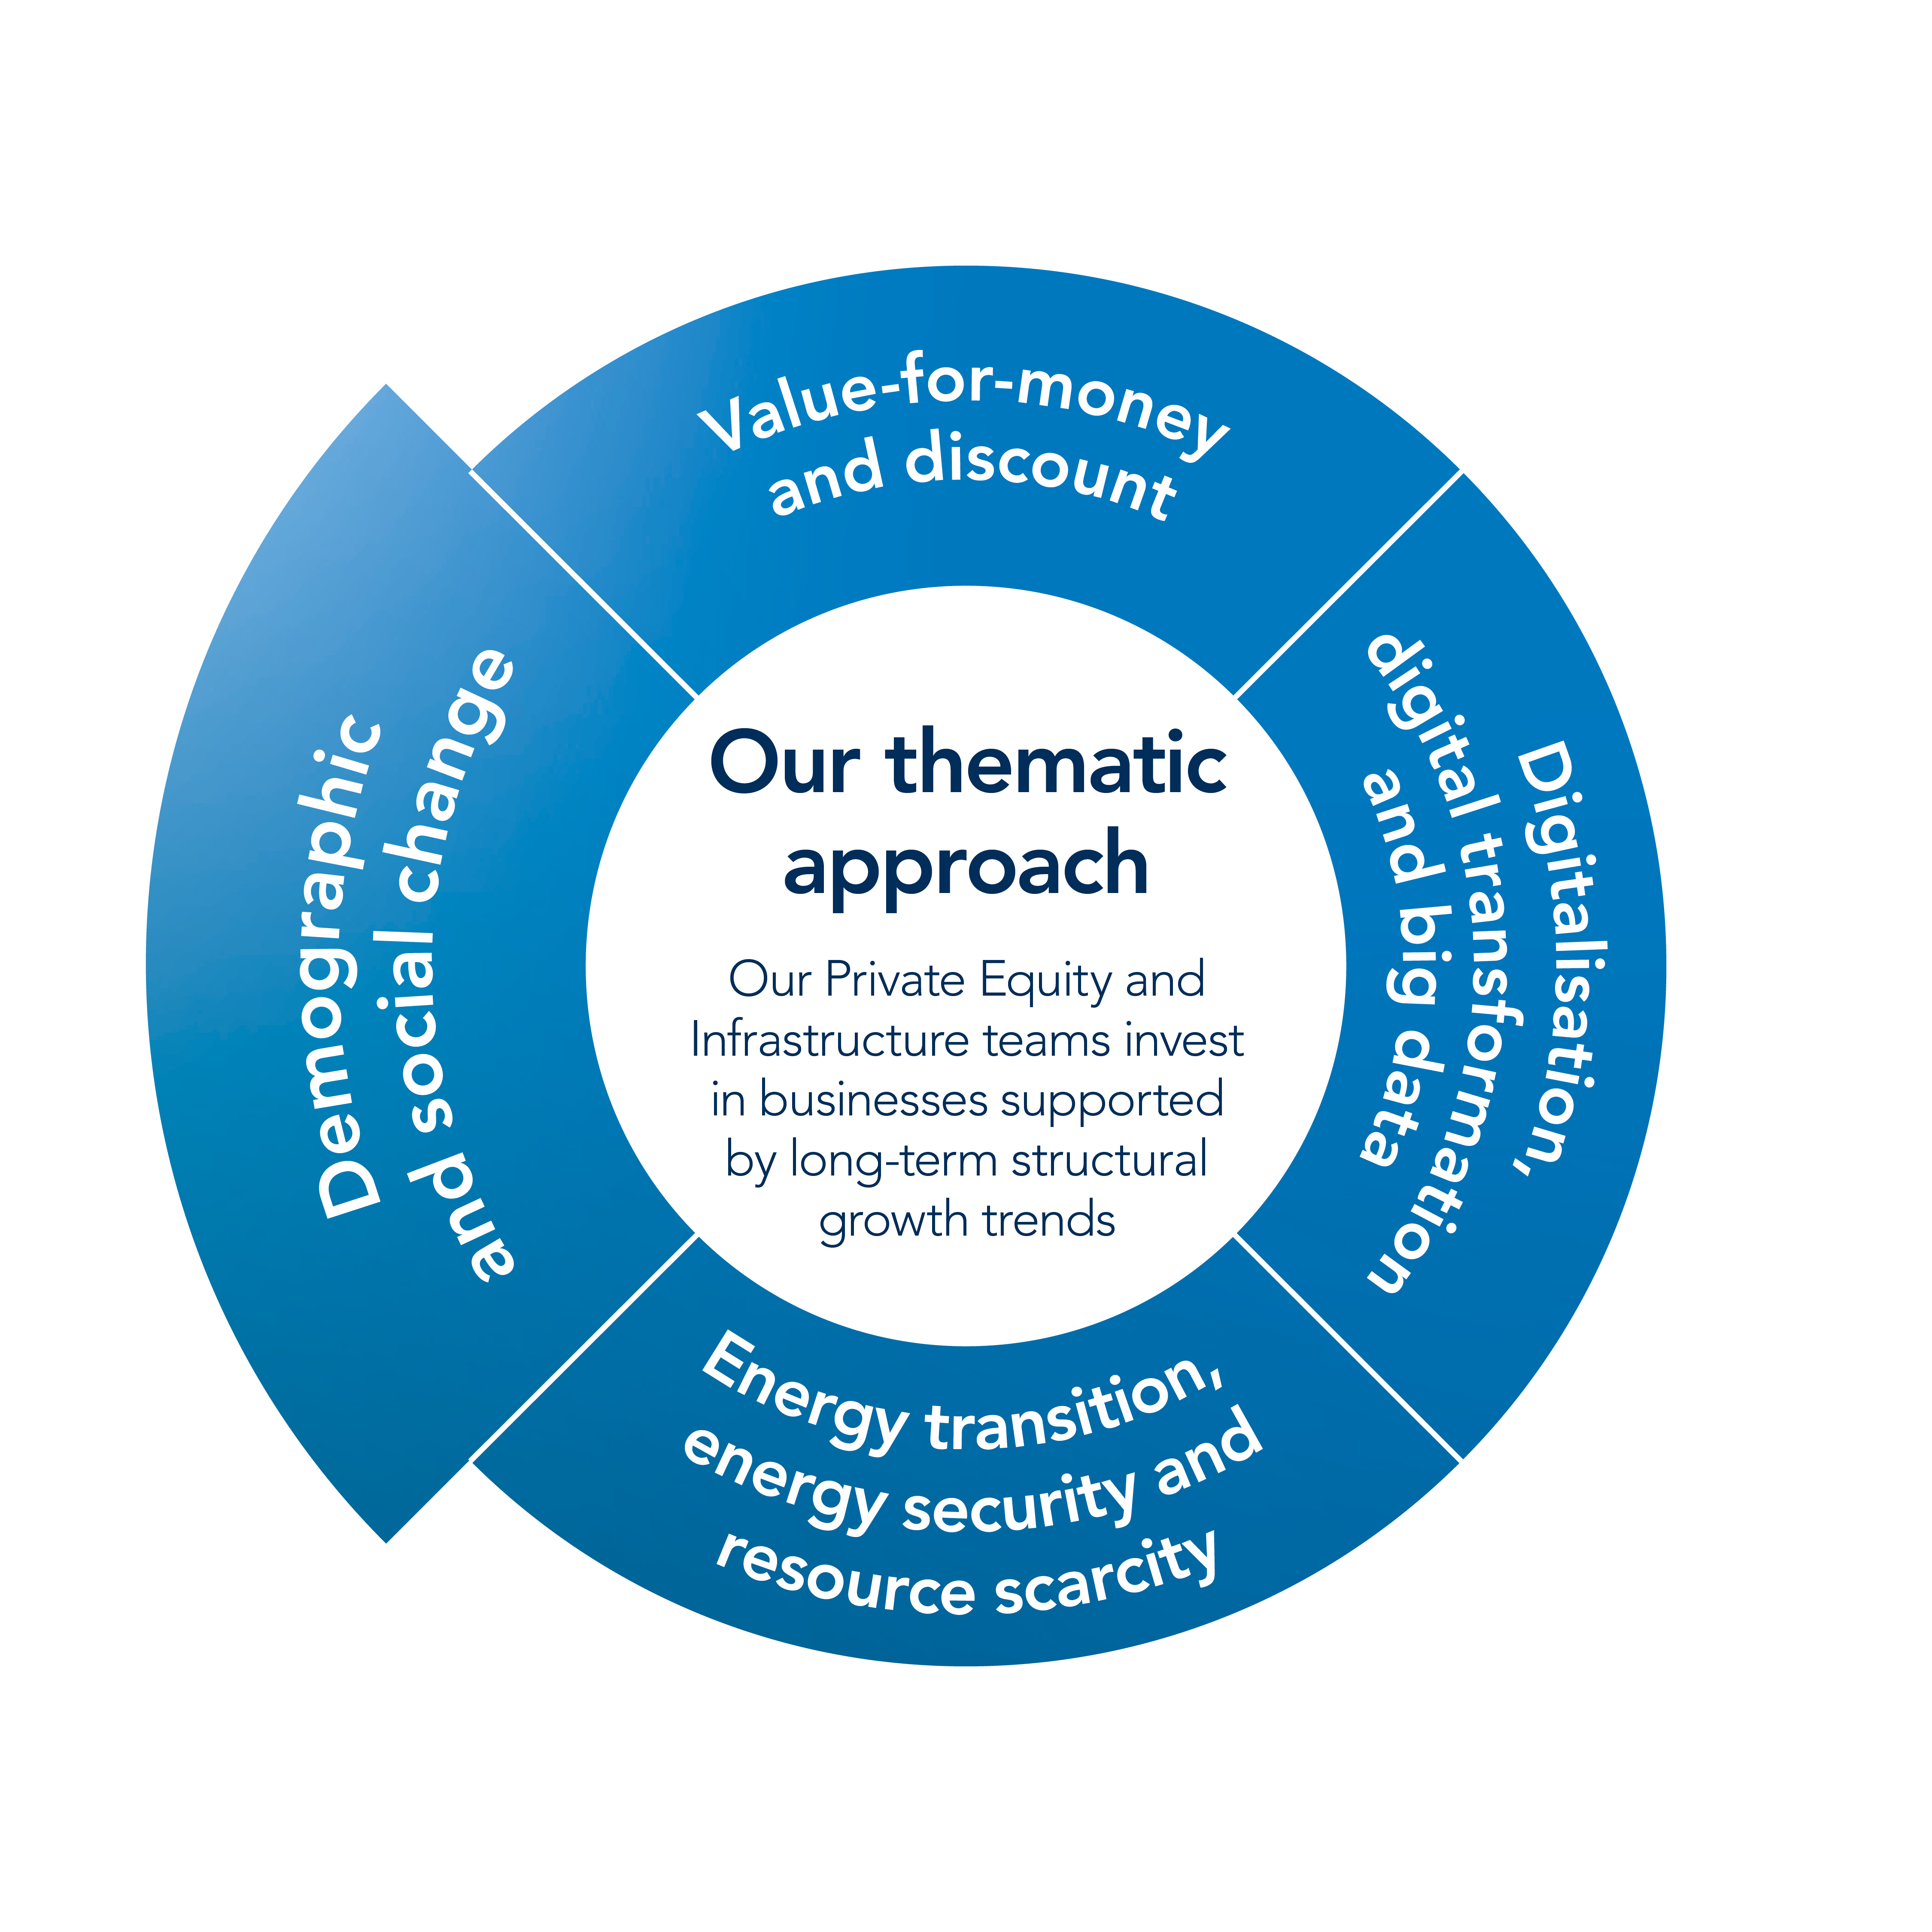
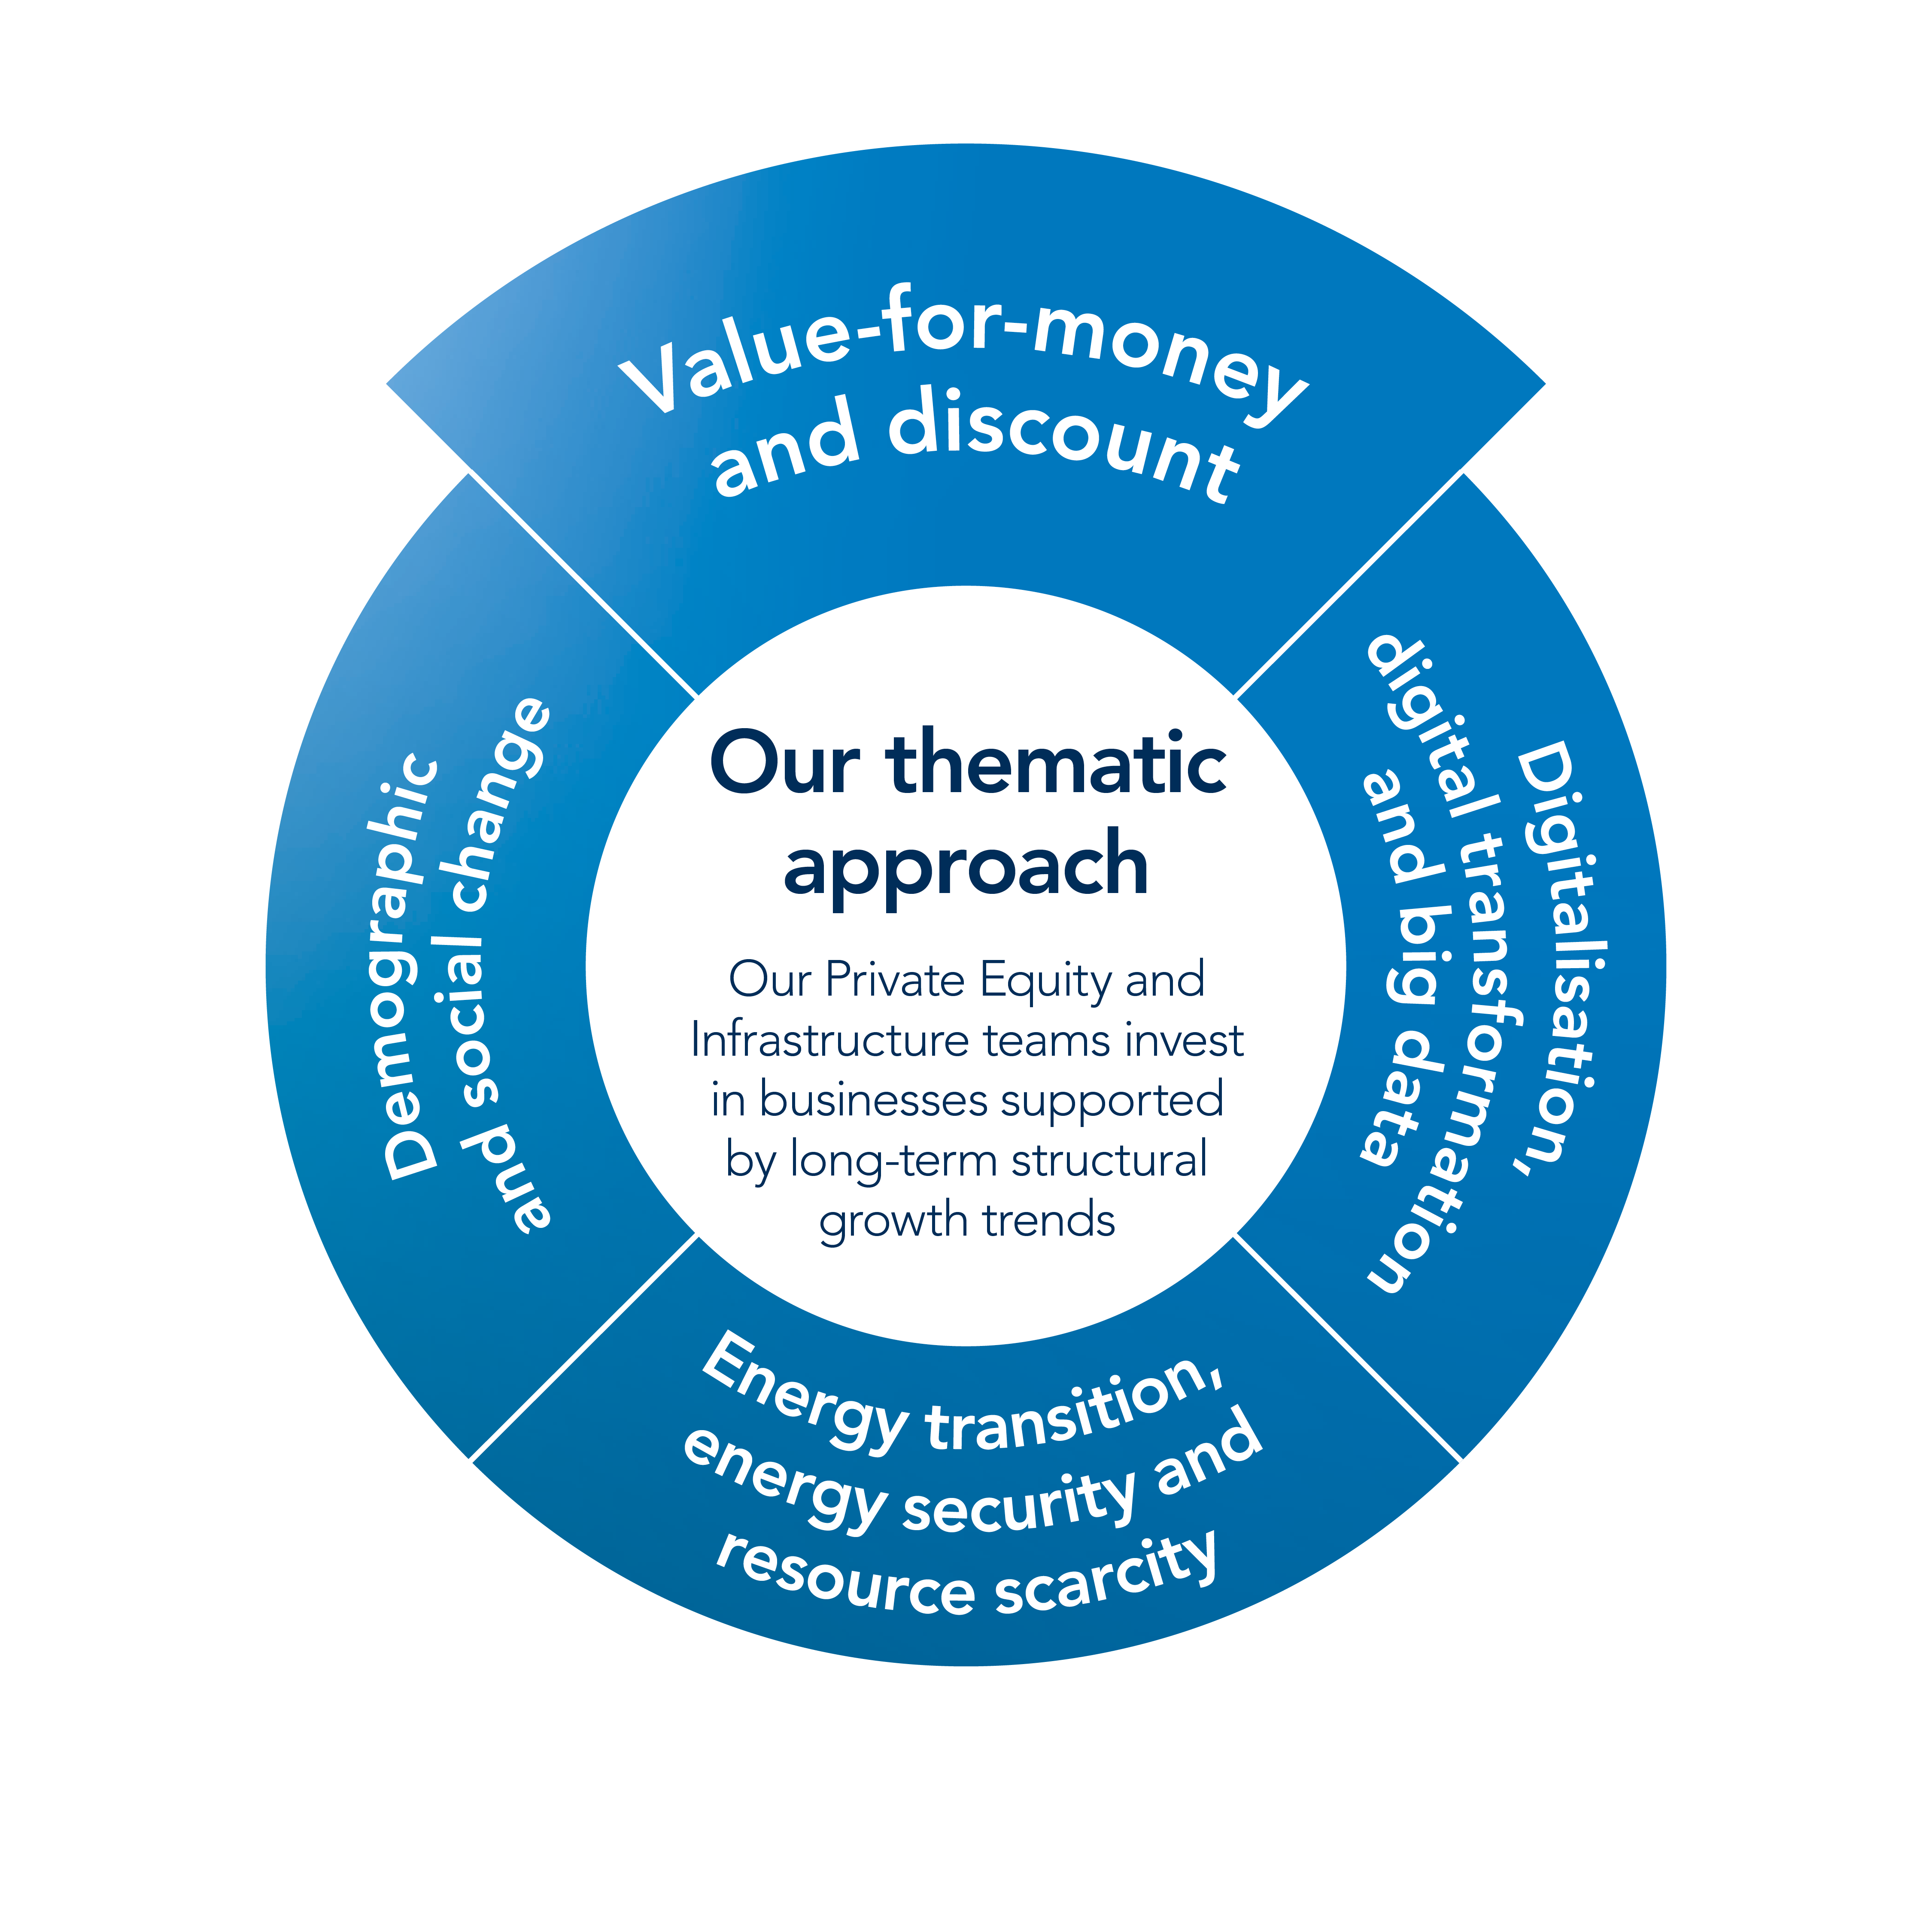
Thematic approach
Our Private Equity and Infrastructure teams invest in businesses supported by long-term structural growth trends.
Our investment approach
Our strong values and institutional culture
Our people
Global network
Our brand and reputation
Who benefits
Our model is capable of delivering mid-teen returns to shareholders through the investment cycle
-
25%
Total return on opening shareholders’ funds in FY2025
-
73.0p
Dividend per share for FY2025
-
0.4%
Operating costs as a percentage of our FY2025 AUM
Our model is capable of delivering mid-teen returns to shareholders through the investment cycle
-
25%
Total return on opening shareholders’ funds in FY2025
-
73.0p
Dividend per share for FY2025
-
0.4%
Operating costs as a percentage of our FY2025 AUM
Strategic objectives
-
Grow investment portfolio earnings
-
Realise investments with good cash-to-cash returns
-
Maintain an operating cash profit
-
Use our strong balance sheet
-
Increase shareholder distributions
Key performance indicators
Gross investment return (“GIR”) as % of opening portfolio value
The performance of the proprietary investment portfolio expressed as a percentage of the opening portfolio value.
Link to strategic objectives:

NAV per share
The measure of the fair value per share of our investments and other assets after the net cost of operating the business and dividends paid in the year.
Link to strategic objectives:

Cash realisations
Support our returns to shareholders, as well as our ability to invest in new opportunities.
Link to strategic objectives:

Cash investment
Identifying and investing in new and further investments is a key driver of the Group’s ability to deliver attractive returns.
Link to strategic objectives:

Operating cash profit
By covering the cash operating cost of running our business with cash income, we reduce the potential dilution of capital returns.
Link to strategic objectives:

Total shareholder return
The return to our shareholders through the movement of the share price and dividends paid during the year.
Link to strategic objectives:

A responsible approach
We believe that a responsible approach to investment aligns with our values and supports the delivery of attractive returns from our portfolio over the long term.
We have majority or significant minority holdings in our core portfolio companies and are represented on their boards.
We exercise our influence to ensure that they consider their material environmental and social impacts and dependencies and, where relevant, support them in developing plans to mitigate sustainability risks and invest in value creation opportunities that may arise.
Downloads
-
Annual report and accounts FY2025
(pdf 12.7mb) -
Business review
(pdf 1.42mb) -
Performance and risk
(pdf 736kb) -
Sustainability
(pdf 1.12mb) -
Governance
(pdf 1.55mb) -
Audited financial statements
(pdf 1.17mb) -
Portfolio and other information
(pdf 316kb) -
Annual Report and Accounts 2025
(ESEF/iXBRL with built-in iXBRL viewer) (7.9mb) -
Annual Report and Accounts 2025
(ESEF/iXBRL) (7.9mb)


