3i Group plc
Annual report and accounts 2024 highlights

Our purpose
We generate attractive returns for our shareholders and co-investors by investing in private equity and infrastructure assets.
As proprietary capital investors we have a long-term, responsible approach.
We aim to compound value through thoughtful origination, disciplined investment and active management of our assets, driving sustainable growth in our investment companies.
Driving resilient growth in our portfolio companies
Our strong result in FY2024 reflects another year of thoughtful and careful allocation of capital and active asset management of our portfolio companies.
David Hutchison
Chair
3i delivered another strong result
The power of Action’s compounding growth coupled with several other strongly performing portfolio companies underpins both our FY2024 result, and our conviction in allocating capital into existing “winners”.
Simon Borrows
Chief Executive
At a glance
3i is an investment company specialising in Private Equity and Infrastructure. We invest in mid-market companies headquartered in Europe and North America.
-
3i Group investment portfolio value
as at 31 March 2024
£ 21.6 bn
(2023: £18.4bn)
-
Total assets under management
as at 31 March 2024
£ 34.7 bn
(2023: £29.9bn)
Private Equity
£9.6bn
Infrastructure
£1.5bn
Scandlines
£0.5bn
Private Equity
£27.5bn
Infrastructure
£6.7bn
Scandlines
£0.5bn
Private Equity
What we do
Our Private Equity business is funded principally from our proprietary capital, with some funding from co-investors for selected assets. Its principal focus is to generate attractive capital returns.
Our teams invest in the following sectors:
-
 Consumer
-
 Healthcare
-
 Industrial Technology
-
 Services
-
 Software
Infrastructure
What we do
Our Infrastructure business manages assets on behalf of third-party investors and 3i’s proprietary capital, with the objective of generating attractive capital returns and earning fund management fees and portfolio income for the Group.
Our teams invest in the following sectors:
-
 Communications
-
 Utilities
-
 Social Infrastructure
-
 Healthcare
-
 Transport/Logistics
-
 Energy
Our business model
We aim to compound value over time by investing in mid-market companies to create a diverse portfolio with strong growth potential.
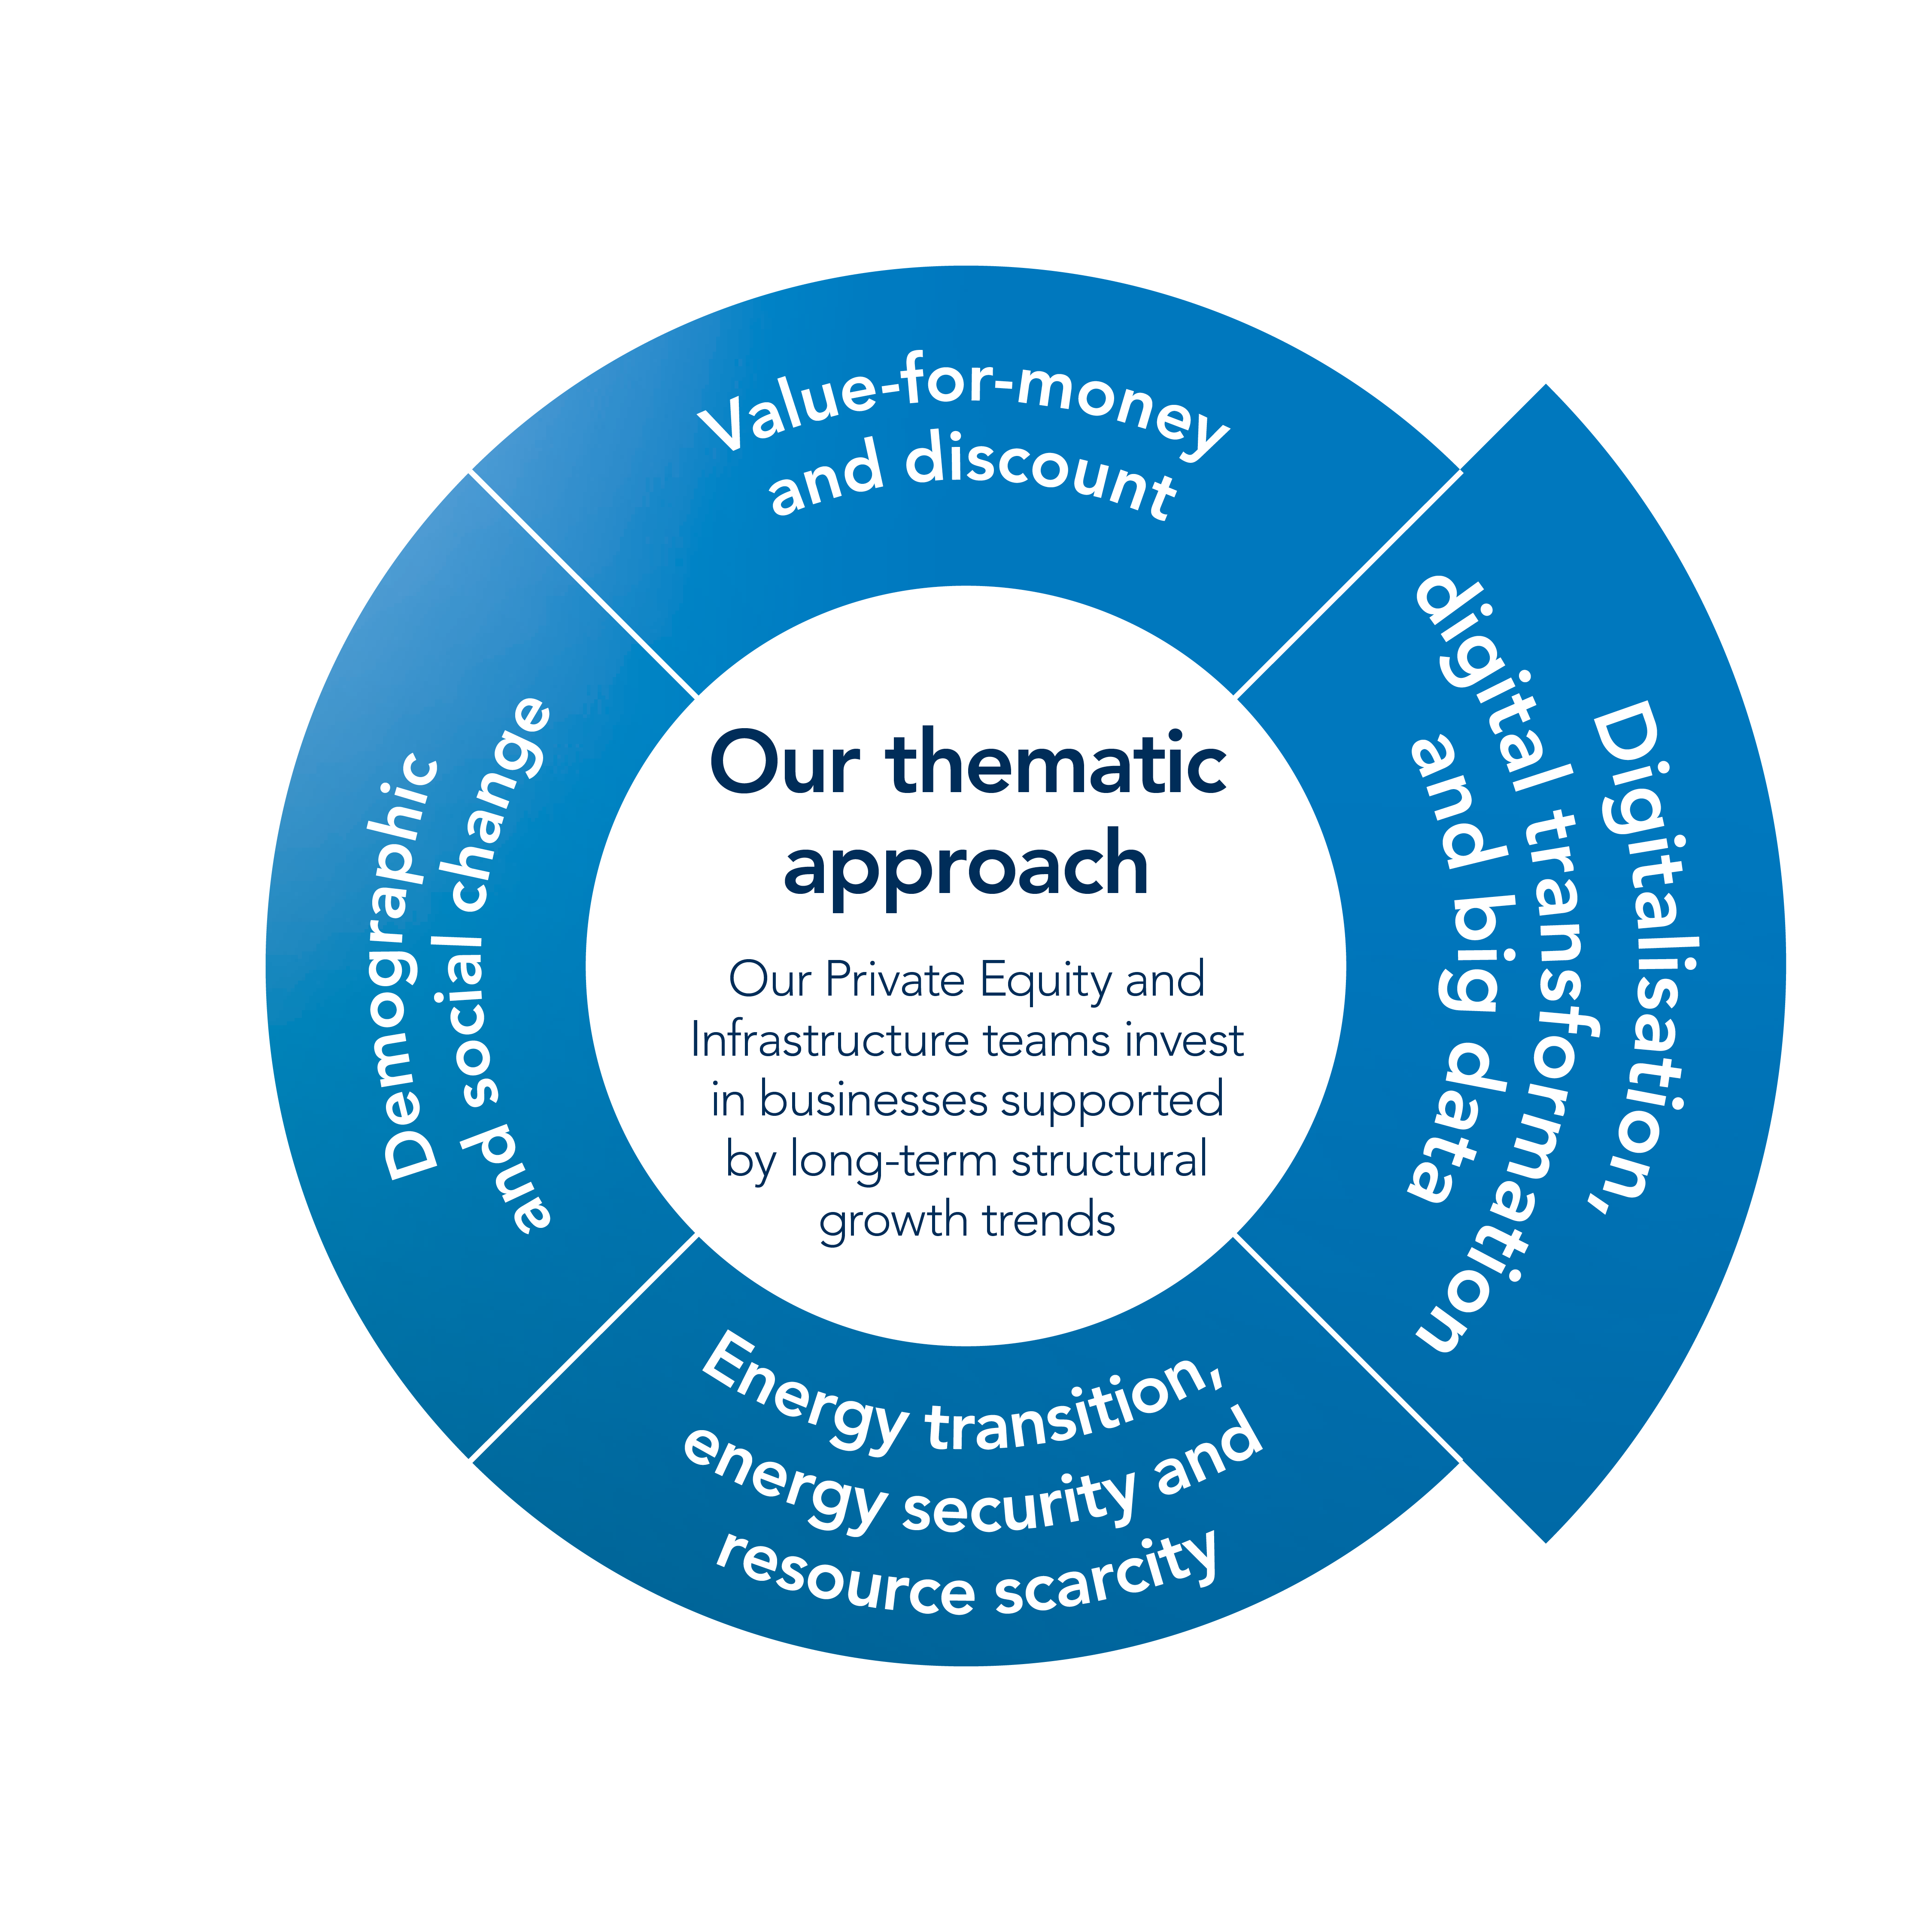
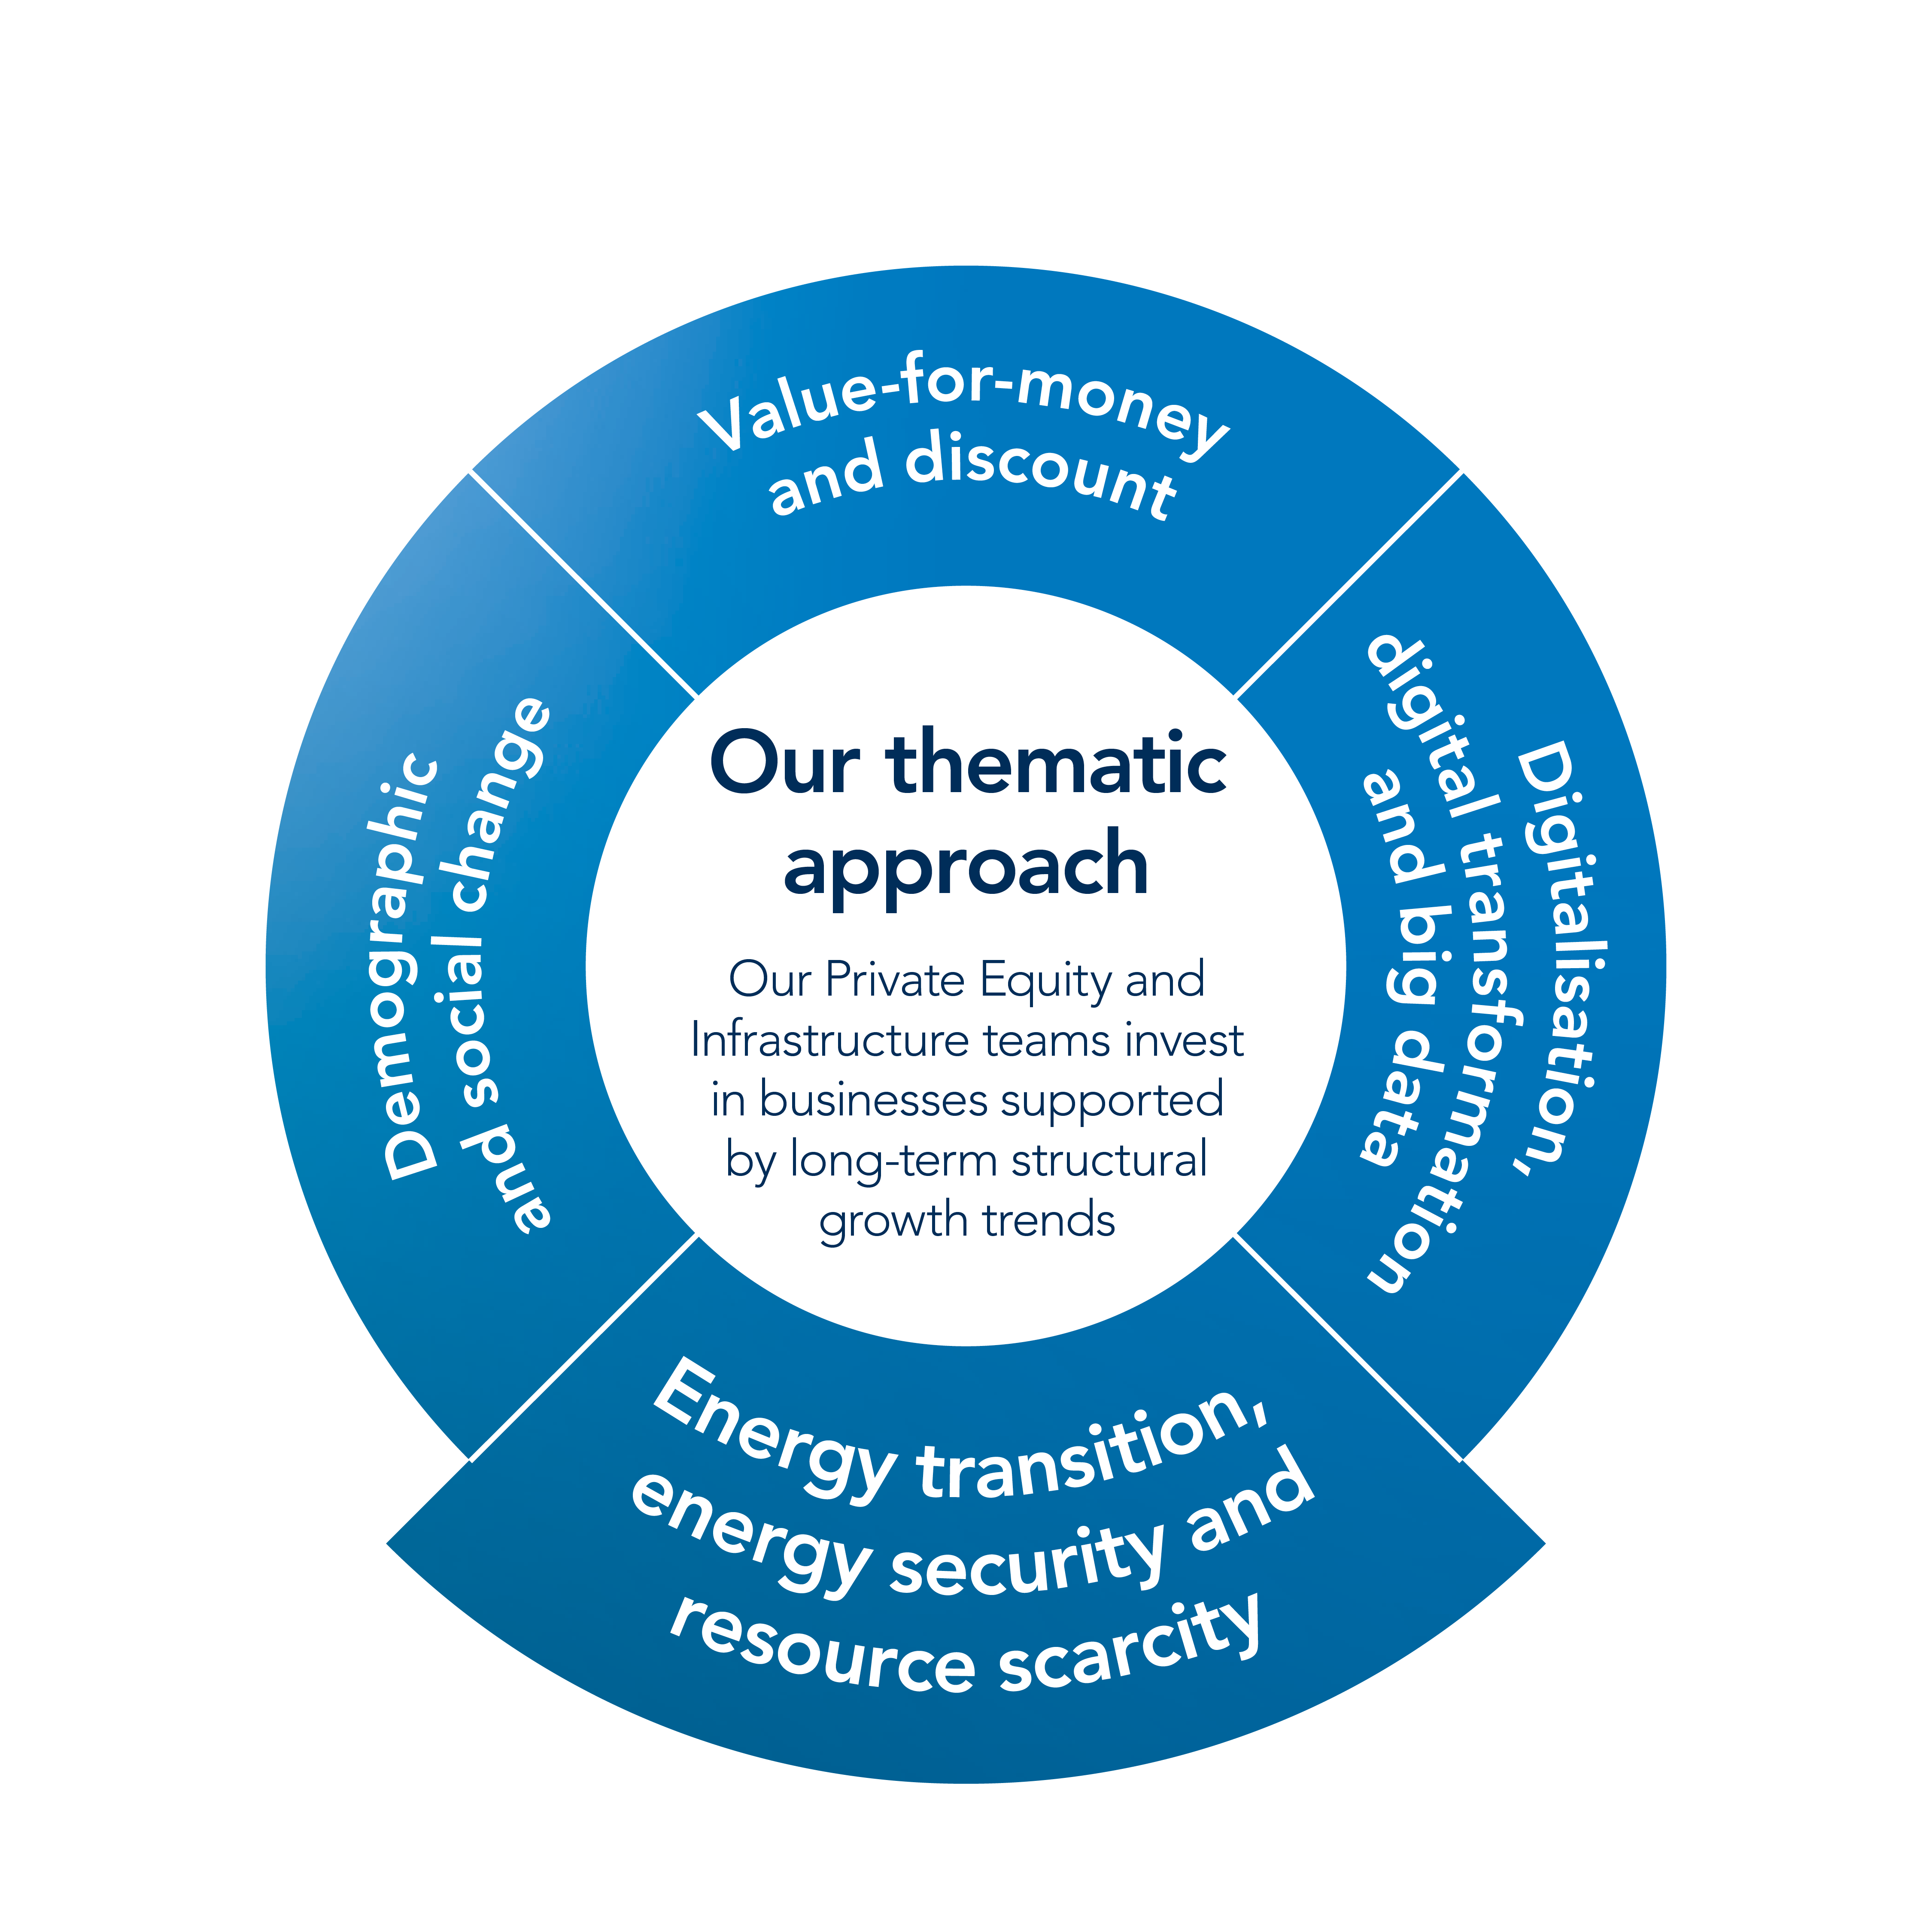
Our thematic approach
Our Private Equity and infrastructure teams invest inert business supported by long term structual growth trends
Key enablers of value
Permanent capital and long-term investment horizon
We aim to compound our proprietary capital value through conviction in our best investments and by deploying our capital in new mid-market companies. Our proprietary capital affords us a long-term investment horizon.
A long-standing office network
We have had teams on the ground across the UK, continental Europe and the US for many decades, which have built strong networks within their local business communities.
An expert and diverse team
Our international teams are formed of local people with great knowledge and experience of their geography and sector. We view diversity as a strength and a plurality of perspectives enhances our origination, value creation and decision making.
Careful portfolio construction
We approach portfolio construction with great care, originating opportunities thematically and investing selectively in businesses that can benefit from long-term structural growth trends.
Active asset management
We engage with portfolio companies’ management teams to manage risks and invest in initiatives that support long-term sustainable growth.
A strong brand and reputation
As an investment company with a history of over 75 years, our brand strength and long-term approach underpin our reputation as a responsible investor and business.
Strong values and institutional culture
We promote a strong culture of integrity among our employees and embed that culture in our policies and processes.

Strategic objectives
-
 Grow investment portfolio earnings
 -
 Realise investments with good cash‑to‑cash returns
 -
 Maintain an operating cash profit
 -
 Use our strong balance sheet
 -
 Increase shareholder distributions
Key performance indicators
Gross investment return (“GIR”) as % of opening portfolio value
The performance of the proprietary investment portfolio expressed as a percentage of the opening portfolio value.
Link to strategic objectives:
NAV per share
The measure of the fair value per share of our investments and other assets after the net cost of operating the business and dividends paid in the year.
Link to strategic objectives:

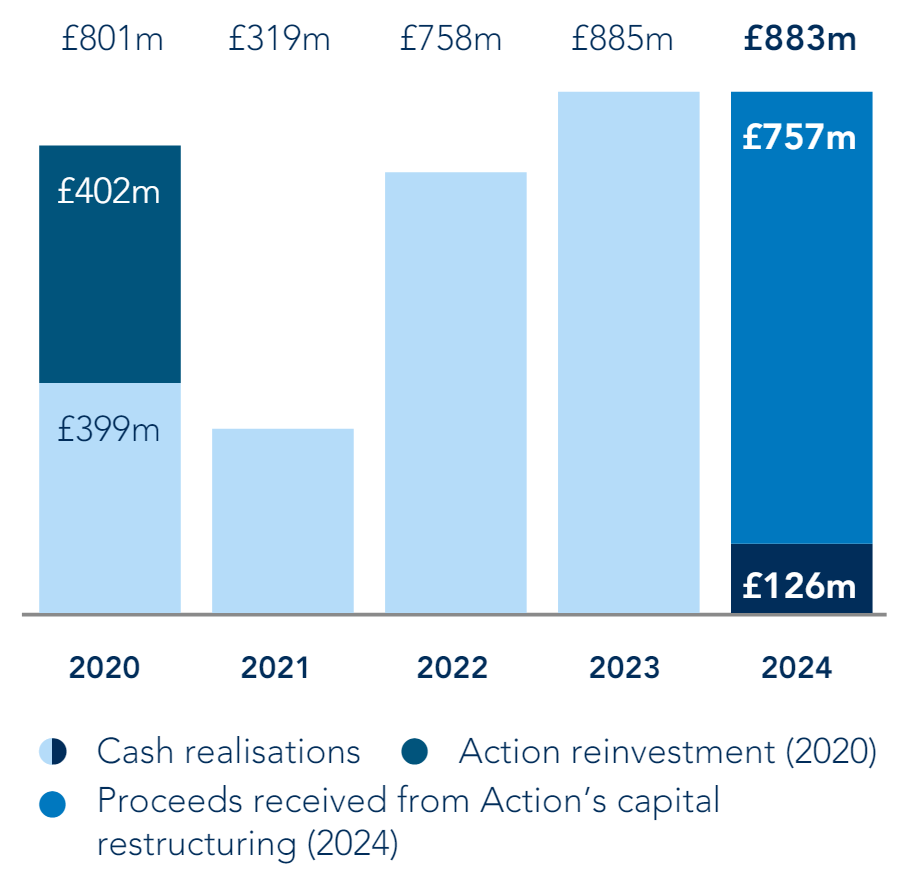
Cash realisations
Support our returns to shareholders, as well as our ability to invest in new opportunities.
Link to strategic objectives:
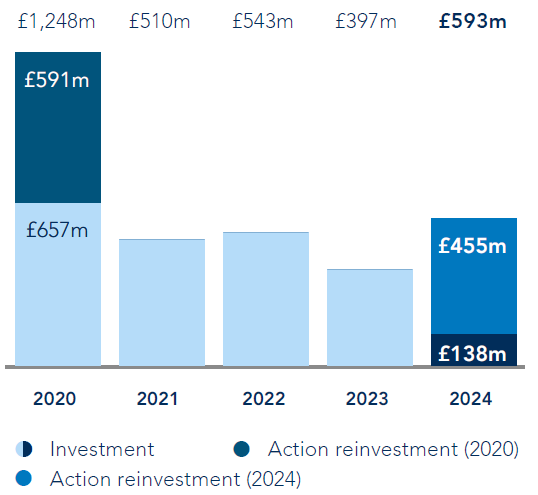
Cash investment
Identifying and investing in new and further investments is a key driver of the Group’s ability to deliver attractive returns.
Link to strategic objectives:
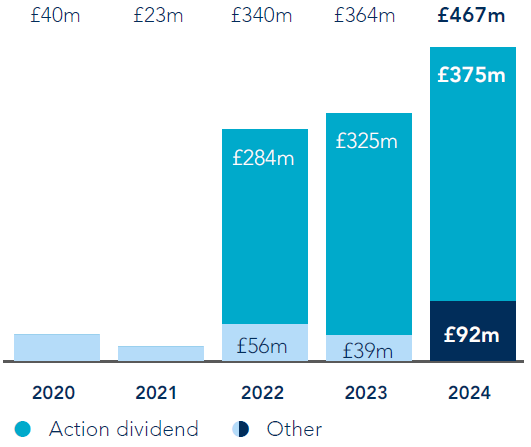
Operating cash profit
By covering the cash operating cost of running our business with cash income, we reduce the potential dilution of capital returns.
Link to strategic objectives:
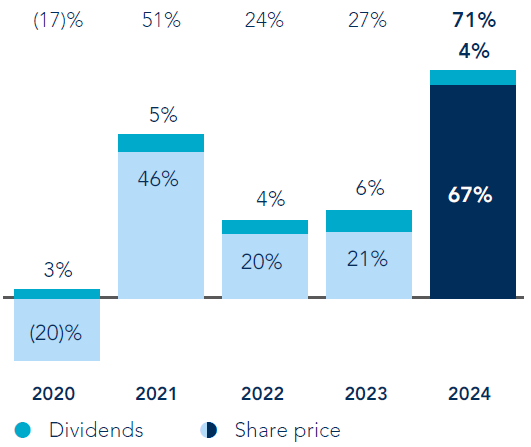
Total shareholder return
The return to our shareholders through the movement in the share price and dividends paid during the year.
Link to strategic objectives:
 |
Business review
We invest in mid-market businesses headquartered in Europe and North America. Once invested, we work closely with our portfolio companies to deliver ambitious growth plans, and to realise strong cash returns for 3i shareholders and other investors.
At a glance
-
Gross investment return
£ 4,059m or 25%
(2023: £4,966m or 40%)
-
Portfolio dividend income
£ 439 m
(2023: £345m)
-
Cash investment
£ 556 m
(2023: £381m)
-
Portfolio growing earnings
93 %
(2023: 90%)
-
Realised proceeds
£ 866 m
(2023: £857m)
-
Portfolio value
£ 19,629 m
(2023: £16,425m)
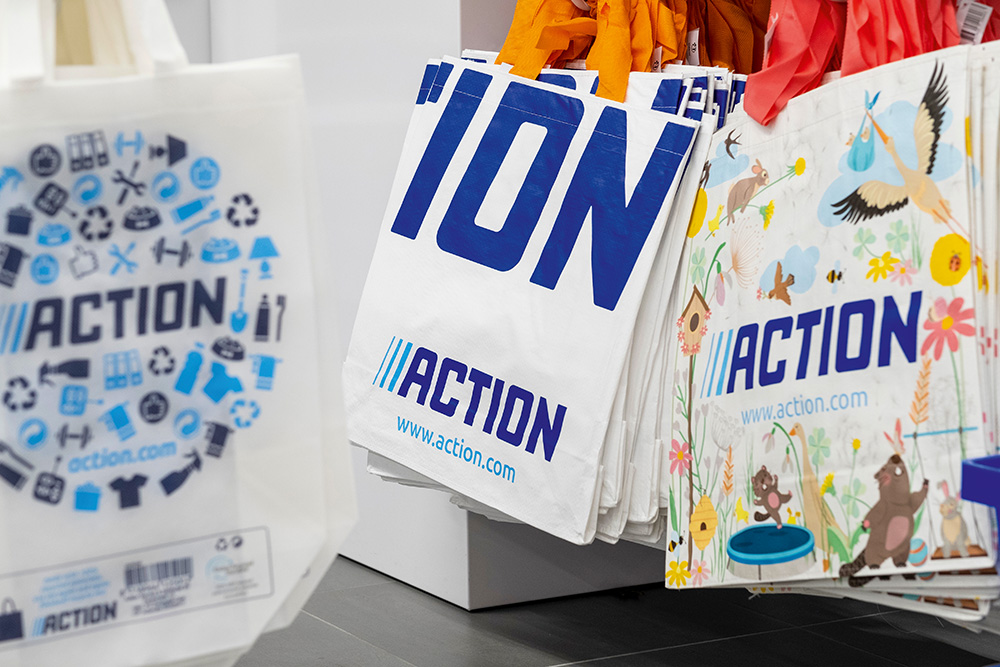
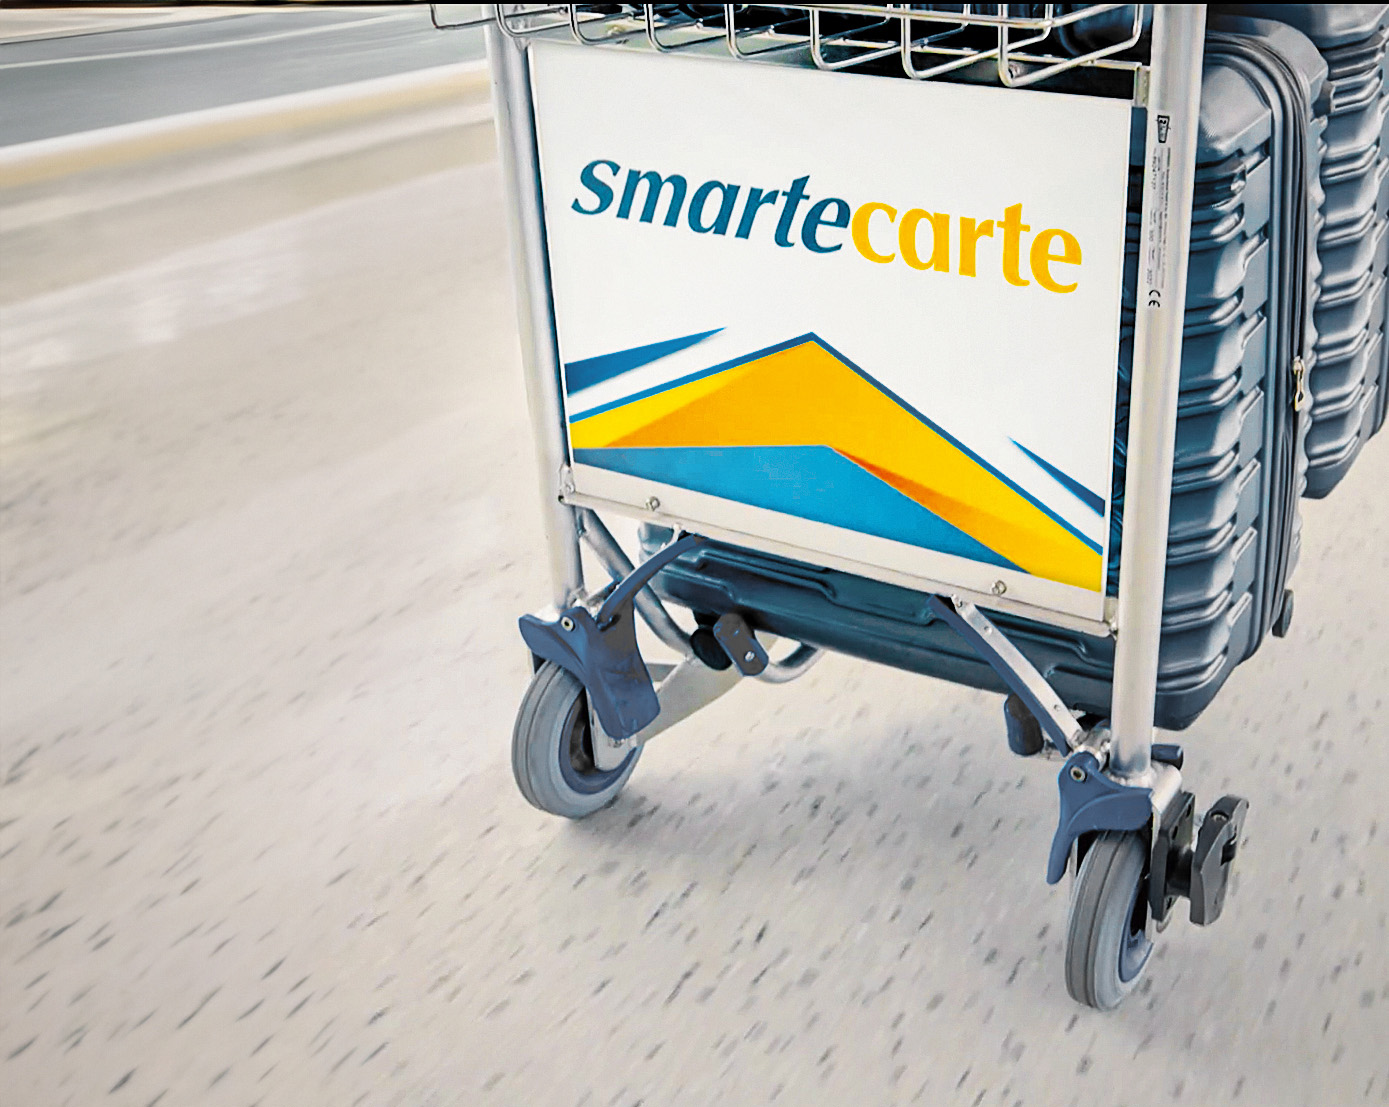
Action
What is Action?
Action is the fastest growing non-food discount retailer in Europe. With over 2,600 stores across 12 European countries, Action offers its customers an ever-changing variety of 6,000 products at the lowest possible prices.
Our investment in Action
Following our initial investment in 2011, we have actively managed Action through its incredible compounding growth story, with the business surpassing the €10 billion revenue milestone for the first time in 2023.
At 31 March 2024, our investment in Action formed 72% of our Private Equity portfolio value. The business has returned over £2.9 billion of proceeds over our hold period. This reinforces our long-term investment horizon for this investment.

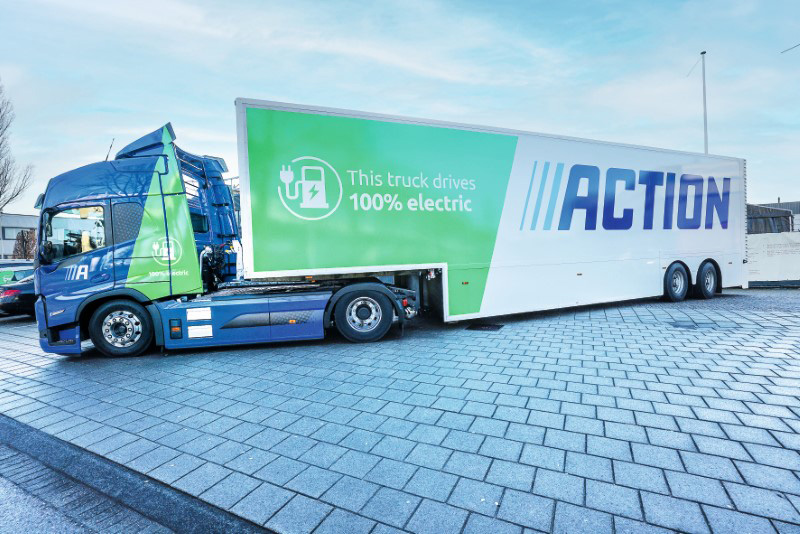
European Bakery Group’s (EBG) acquisitions of coolback and Panelto Foods
EBG completed the transformational
acquisitions of coolback and Panelto Foods in 2023, establishing a high-quality pan-European platform in the fragmented European private label market for bake-off bread.

MAIT’s acquisitions of etagis and Quadrix
Since our investment in 2021, MAIT has made seven bolt-on acquisitions, including two in FY2024, proving itself as an active consolidator in a fragmented market.

ten23 health
ten23 health is a biologics-focused contract development and manufacturing organisation (“CDMO”).
The business operates across two sites in Visp and Basel, Switzerland, both of which have seen progression across their operational initiatives and capability expansion activities in FY2024.

We manage a range of funds investing principally in mid-market economic infrastructure and operational projects in Europe and North America. Infrastructure is a defensive asset class that provides a good source of income and fund management fees for the Group, enhancing the returns on our proprietary capital.
At a glance
-
Gross investment return
£ 99m or 7%
(2023: £86m or 6%)
-
AUM
£ 6.7 bn
(2023: £6.4bn)
-
Cash income
£ 113 m
(2023: £107m)
AmWaste
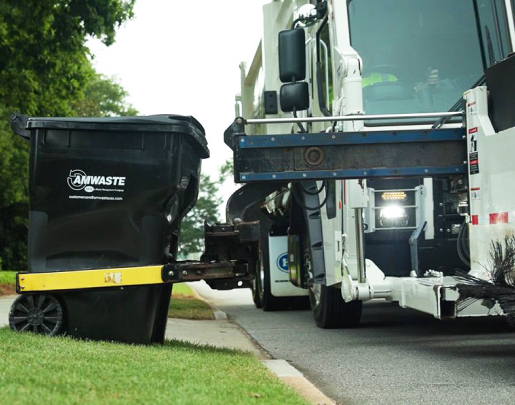
AmWaste, founded in 2010, is a provider of non-hazardous solid waste disposal services in the Southeastern US with operations in Alabama, Georgia and Louisiana. It operates eight landfill sites, eight transfer stations and one materials recovery facility.
A responsible approach
Our sustainability strategy is defined by three key priorities:
We consider the sustainability profile of portfolio companies as part of our investment decision. And use our influence to ensure they have strategies to address key environmental and social impacts.
Action
Action believes that sustainability should be accessible for all. Its comprehensive Action Sustainability Programme is structured around four pillars: people, planet, product and partnerships. It sets out Action’s ambitions on climate, the development of its people, on community partnerships and ensuring minimum social and environmental standards in its supply chain.
ten23 health
ten23 is a leading development, manufacturing and testing provider of sterile products for the pharmaceutical and biotech industries. Since its establishment in 2021, ten23 has been strongly purpose-driven, with commitments to placing patients, people and planet at the centre of its decisions, and operating with a core principle of “fairstainability” (fairness and sustainability).

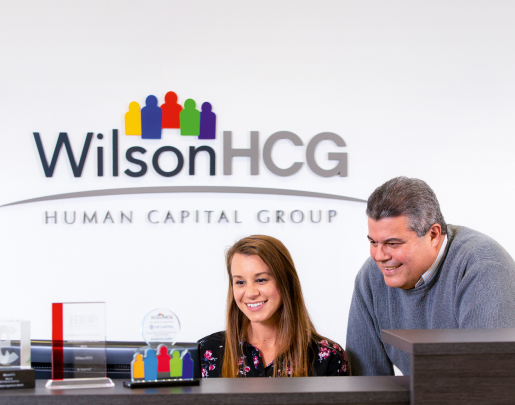
WilsonHCG
WilsonHCG is a provider of talent solutions offering recruitment process outsourcing, executive search, contingent workforce solutions, labour market intelligence and talent consulting services.
As a professional services business, employee development and recognition, and diversity are material topics for WilsonHCG. The company is focused on attracting, developing and retaining a diverse, global pool of over 1,500 talented employees, and supporting their clients to do the same.
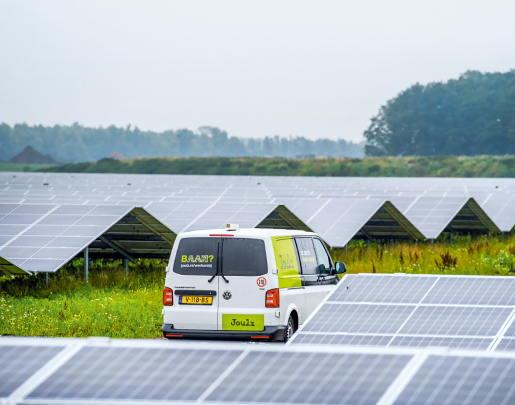
Joulz
Joulz owns and provides essential energy infrastructure equipment and complementary services to industrial and commercial customers in the Netherlands, assisting them in their energy transition journey.
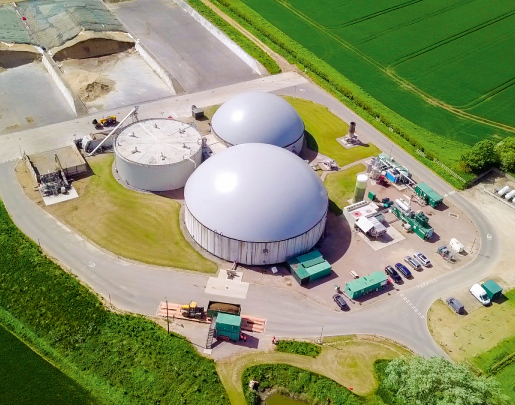
Future Biogas
Future Biogas is one of the largest Anaerobic Digestion (“AD”) plant developers and producers of biomethane in the UK.
Biogas can be used to generate renewable electricity or be upgraded into biomethane and injected into the UK’s national gas network. There is growing demand for domestically produced biomethane which, as a direct substitute for fossil natural gas, plays an essential role in decarbonising some of the UK’s gas dependent sectors such as heat, transport and manufacturing.
Recruiting, retaining and developing our talent is a priority. We value diversity and believe that a variety of perspectives enhances our decision making.
3i is an official sponsor of Level 20
Level 20 is a not-for-profit organisation dedicated to improving gender diversity in the European private equity industry. It is sponsored by over 120 private equity firms. Its ambition is for women to hold 20% of senior positions in this industry. It works to empower women who already work within the industry, encourage new talent to join and provide leadership teams with insight and best practice solutions to help them address current gender imbalances within the industry and their firms.

3i participates in the GAIN Empower Investment Internship Programme
GAIN (Girls Are INvestors) is a community of investors, with charitable status, set to improve gender diversity in investment management by building a talent pipeline of entry-level female and non-binary candidates. GAIN aims to inform young women with online resources and to inspire them with a strong network of relevant role models, who speak in high schools and universities around the UK and feature on its online channels, delivering compelling and high-impact messages on the many benefits of investing as a career.
3i participates in the #10000BlackInterns initiative by the 10000 Interns Foundation
3i has partnered with the 10,000 Interns Foundation since it was first established in 2021 to help transform the horizons and prospects of young black people in the UK. The #10000BlackInterns initiative seeks to offer 2,000 paid internships to black students and graduates each year for five consecutive years. The initiative has partnered up with firms across over 30 sectors, delivering internships across a range of business functions.

We embed responsible business practices throughout our organisation by promoting our values and culture.
Career Ready
Since 2018 we have partnered with Career Ready, a UK-based organisation that connects employers with schools and colleges to provide disadvantaged young people aged 15-18 with mentors, internships, masterclasses, and employer-led activities that prepare them for the world of work. 3i takes part in the mentoring programme which supports young people aged 16 to 18 who lack the opportunities, professional networks and confidence to find their undiscovered talents.
Community Links
Community Links is a social action charity based in Newham, one of the most deprived boroughs in London. It offers free legal advice, provides youth and employment services, delivers projects to promote the early diagnosis of cancer by increasing the uptake of NHS screening programmes, and advocates for social change by contributing to public policy debates. At Christmas, our London-based employees raised £3,000 for the charity’s Toy Appeal. This enabled the charity to buy c.250 toys, which were distributed to 135 families.

The Passage
The Passage, based near our London office in Westminster, is a homelessness charity whose services have a high impact on the local community. We support The Passage’s Employment and Education team, which provides homeless people with life skills and helps them to end their homelessness by returning to work. Support includes computer training, literacy classes, help with CV writing and job hunting, and financial and welfare rights advice. During the year, 17 of our London-based staff volunteered for The Passage and the charity was one of the recipients of the funds raised by our London- based staff at our Summer Charity event.
Re-engage
Re-engage is a UK national charity dedicated to tackling loneliness and social isolation amongst older people. It provides life-enhancing social connections for older people at a time in their lives when their social circles are diminishing. Supported by a network of volunteers, the charity provides regular opportunities for companionship for thousands of older people across the UK.
Snowdon Trust
The Snowdon Trust aims to break down barriers for disabled students on their journey through post-school education and into employment, for instance through grants to cover the additional costs that students incur because of their disability or through scholarships. Snowdon Trust was one of the recipients of the funds raised by our London-based staff at our Summer Charity event.